
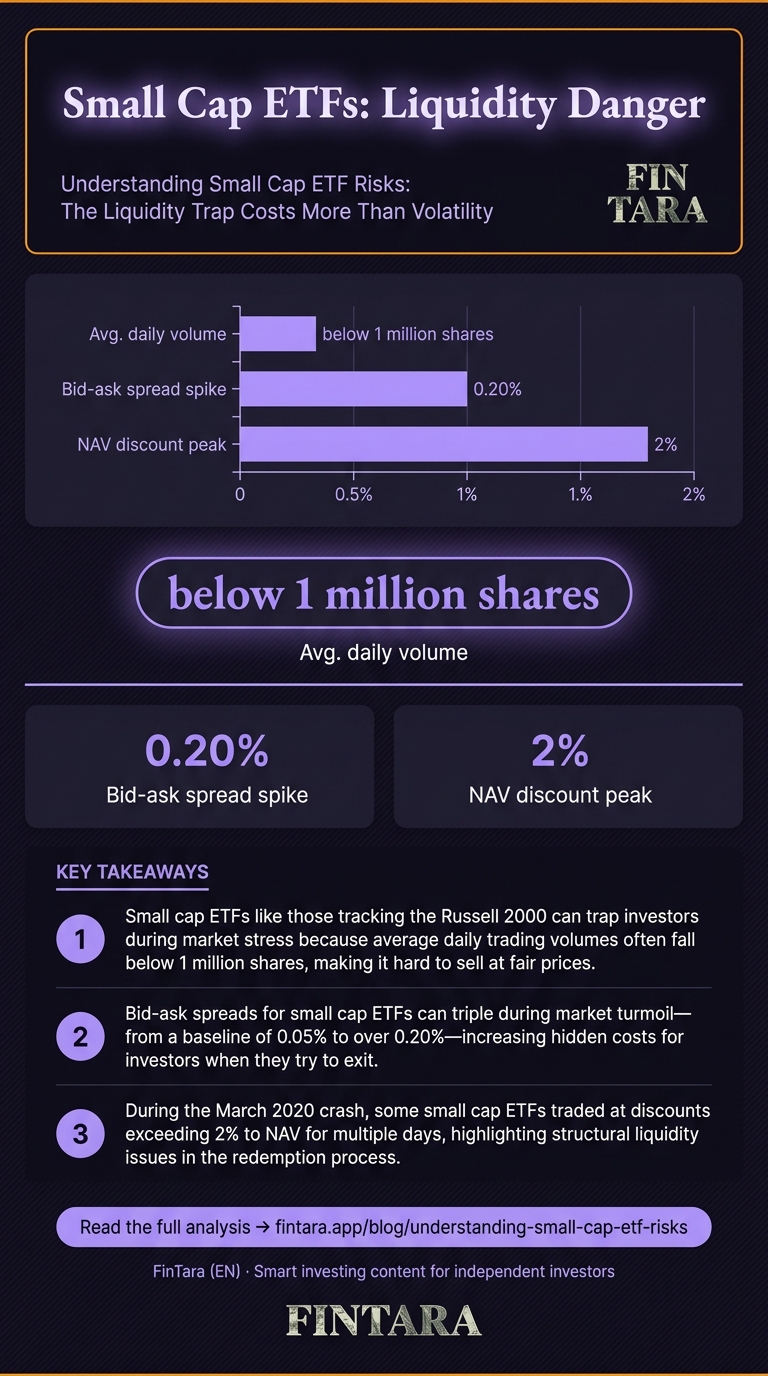
Small cap ETFs present a structural vulnerability that most investors ignore until they try to exit during a panic. The Russell 2000 includes over 2,000 stocks with market caps under $2 billion, and average daily trading volume for many small cap ETFs sits below 1 million shares. This creates a liquidity mismatch: you can buy the ETF easily during calm markets, but selling it under stress can trigger price dislocations that erase months of gains. The risk isn't just volatility—it's being trapped in an asset you cannot liquidate at a fair price when you need to. This matters for retail investors using these funds for diversification, because the promised growth comes with an exit cost that standard ETF marketing never mentions.
Why Liquidity Illusions Mask Bid-Ask Spreads
Most investors check an ETF's average spread and assume it reflects real-time trading costs. The reality is that small cap ETF spreads widen dramatically during market stress, often tripling from baseline levels. A bid-ask spread that looks acceptable at 0.05% during normal hours can blow out to 0.20% or more when the underlying stocks become difficult to price. This happens because market makers hedge small cap ETF exposures by trading the underlying stocks, and when those stocks are illiquid, the hedge becomes expensive. The ETF price decouples from net asset value, and you pay the difference.
The mechanism is straightforward but rarely explained. When you sell a small cap ETF share, the authorized participant must redeem it with the fund provider and sell the underlying stocks to close the position. If those stocks trade in thin markets, the participant demands a wider spread to cover the risk. You see this as a lower execution price, not as a spread widening. The result is the same: you receive less than the ETF's quoted NAV, and the gap can be significant during volatile periods.
This is not a theoretical concern. During the March 2020 crash, several small cap ETFs traded at discounts exceeding 2% to NAV for multiple days. Investors who needed to raise cash found themselves selling at prices that reflected not just market panic, but structural illiquidity in the redemption process. The ETF wrapper provides diversification, but it does not eliminate the liquidity risk of the underlying assets—it concentrates it.
The inversion here is critical: when markets are calm, small cap ETFs appear liquid and efficient. That is precisely when you should be most skeptical of their liquidity claims. Stress testing your exit strategy during quiet periods reveals whether your ETF is truly tradable or just conveniently priced when nobody is rushing for the door.
The Expense Ratio Trap Across Providers
 An analyst reviews small cap ETF performance charts on a laptop, highlighting the importance of understanding structural vulnerabilities. — Photo by RDNE Stock project on Pexels
Small cap ETF expense ratios range from 0.15% to 0.60% as of 2023, but the cheapest option is not always the best risk-adjusted choice. A lower expense ratio reduces drag on returns, but it does not compensate for poor tracking error or excessive turnover. Some low-cost small cap ETFs achieve their fees by sampling the index rather than full replication, which can introduce tracking error during volatile periods when the index constituents shift rapidly.
The difference matters over time. A 0.15% expense ratio versus 0.60% on a $100,000 position saves $450 annually, but if the cheaper fund tracks the index poorly and underperforms by 0.50%, you lose the fee savings and then some. Investors should evaluate tracking error alongside expense ratio, because the true cost of ownership includes both. Tracking error for small cap ETFs can range from 0.20% to over 1.00% annually, depending on replication method and index turnover.
Provider choice also affects tax efficiency. In taxable accounts, small cap ETFs with high turnover generate more capital gains distributions, which create tax drag even if the fund itself has low expense ratios. Some providers manage turnover more effectively through in-kind creation and redemption processes, but not all do. You need to check the fund's turnover rate and distribution history, not just the headline fee.
The inversion: a higher expense ratio fund with better tracking and lower turnover may outperform a cheap fund with poor replication. This is counterintuitive for cost-focused investors, but the math holds. Total cost of ownership includes fees, tracking error, and tax impact. The lowest expense ratio does not guarantee the lowest total cost.
Sector Concentration Magnifies Industry-Specific Crashes
 A professional examines stock market data on a laptop, illustrating the practical challenge of exiting small cap ETF positions. — Photo by Tima Miroshnichenko on Pexels
Small cap ETFs often exhibit sector concentration that is invisible to investors who only look at top holdings. The Russell 2000, for example, has heavy weighting in financials, healthcare, and technology—sectors that can move together during macro events. When interest rates rise, regional banks in the small cap space can drop 30% in weeks, pulling the entire ETF down even if other holdings are stable. This is not diversification; it is correlation in disguise.
The concentration risk is amplified by index construction. The Russell 2000 reconstitutes annually, and during that process, some stocks exit and others enter, creating temporary price pressure. If a sector is out of favor, the index may still hold it due to market cap rules, and the ETF will continue tracking that exposure. You are not diversified across sectors—you are diversified across stocks within a few dominant sectors.
Energy and materials are other examples. Small cap energy stocks are highly sensitive to oil prices, and a sudden drop in crude can trigger a cascade of selling in the ETF. The fund holds hundreds of stocks, but if 20% are in energy, the sector move dominates the return. Investors seeking broad diversification may find themselves with a de facto sector bet they did not intend to make.
The inversion: if you want true sector diversification, you may need to combine small cap exposure with other asset classes or sector-specific funds that are not small cap. The small cap ETF alone does not solve sector concentration risk—it merely hides it behind the illusion of broad stock ownership.
Stress Test Your Exit Before You Enter
 Trader monitors small cap ETF liquidity on multiple screens during market volatility — Photo by AlphaTradeZone on Pexels
Before buying any small cap ETF, execute a paper trade that simulates selling during a volatile session. Use your broker's platform to place a limit order and observe the bid-ask spread in real time. Do this during both calm and volatile market hours. If the spread consistently exceeds 0.15% or the order sits unfilled for minutes, the ETF may not be as liquid as advertised. This simple test reveals more than any fact sheet.
Next, check the ETF's average daily volume and compare it to the underlying index constituents. If the ETF trades 500,000 shares daily but tracks an index of 2,000 stocks with an average daily volume of 50,000 shares each, there is a liquidity mismatch. The ETF may trade smoothly until redemptions spike, and then the underlying illiquidity surfaces. You want an ETF where the fund's liquidity aligns with the liquidity of its holdings.
Finally, review the fund's creation and redemption process. Some providers use cash settlements, while others use in-kind transfers. In-kind redemptions are more tax-efficient and can reduce tracking error during volatile periods. The prospectus will describe the process, but it is often buried in legal language. A quick search for "in-kind" or "cash redemption" in the fund documents will tell you which method the provider uses. This affects both cost and risk.
The inversion: do not rely on the ETF's stated liquidity metrics alone. Those metrics reflect average conditions, not worst-case scenarios. Your exit strategy should be stress-tested under conditions that resemble a market panic, not a calm trading day. If you cannot simulate a stressed exit, you should not assume the ETF will provide one.
FAQ
What are the main risks of investing in small cap ETFs?
Small cap ETFs carry liquidity risk, higher volatility, sector concentration, and tracking error. The liquidity risk is often underestimated because it only appears during market stress when bid-ask spreads widen and underlying stocks become difficult to trade.
How does liquidity affect small cap ETF performance?
Liquidity affects performance through bid-ask spreads and redemption costs. During volatile periods, spreads can widen dramatically, reducing execution prices. The ETF may trade at a discount to NAV, and investors receive less than the quoted value when selling.
Are small cap ETFs more volatile than large cap equivalents?
Yes, small cap stocks historically show higher volatility, with standard deviations often 20-30% above large cap equivalents. The ETF wrapper does not eliminate this volatility; it packages it for easier trading, but the underlying risk remains.
What strategies can reduce risks in small cap ETF portfolios?
Combine small cap exposure with other asset classes, stress test your exit strategy, and choose providers with low tracking error and efficient tax management. Do not rely on diversification alone—small cap ETFs can still concentrate risk in specific sectors.
How do expense ratios impact returns for small cap ETFs?
Expense ratios reduce returns directly, but the cheapest fund is not always the best. Tracking error and tax efficiency matter more over time. A higher-cost fund with better replication may outperform a low-cost fund with poor tracking.
Which small cap ETFs have the best risk-adjusted returns?
Risk-adjusted returns depend on tracking error, liquidity, and tax efficiency, not just expense ratio. Without verified performance data, you should evaluate funds based on replication method, turnover, and historical discount-premium behavior during volatile periods.