
The U.S. Treasury's 2025 enforcement campaign against Iran's shadow fleet isn't a policy footnote — it's a structural shock to global vessel routing. Combined with tariff-driven demand shifts on Trans-Pacific and Asia-Europe lanes, these forces are changing where ships go, how containers move, and who pays the premium. Most trade coverage focuses on freight rates. The more important story is fleet geography — which vessels have vanished from certain routes, and what's filling the gap.
Why the Shadow Fleet Story Is Bigger Than the Sanctions Headline
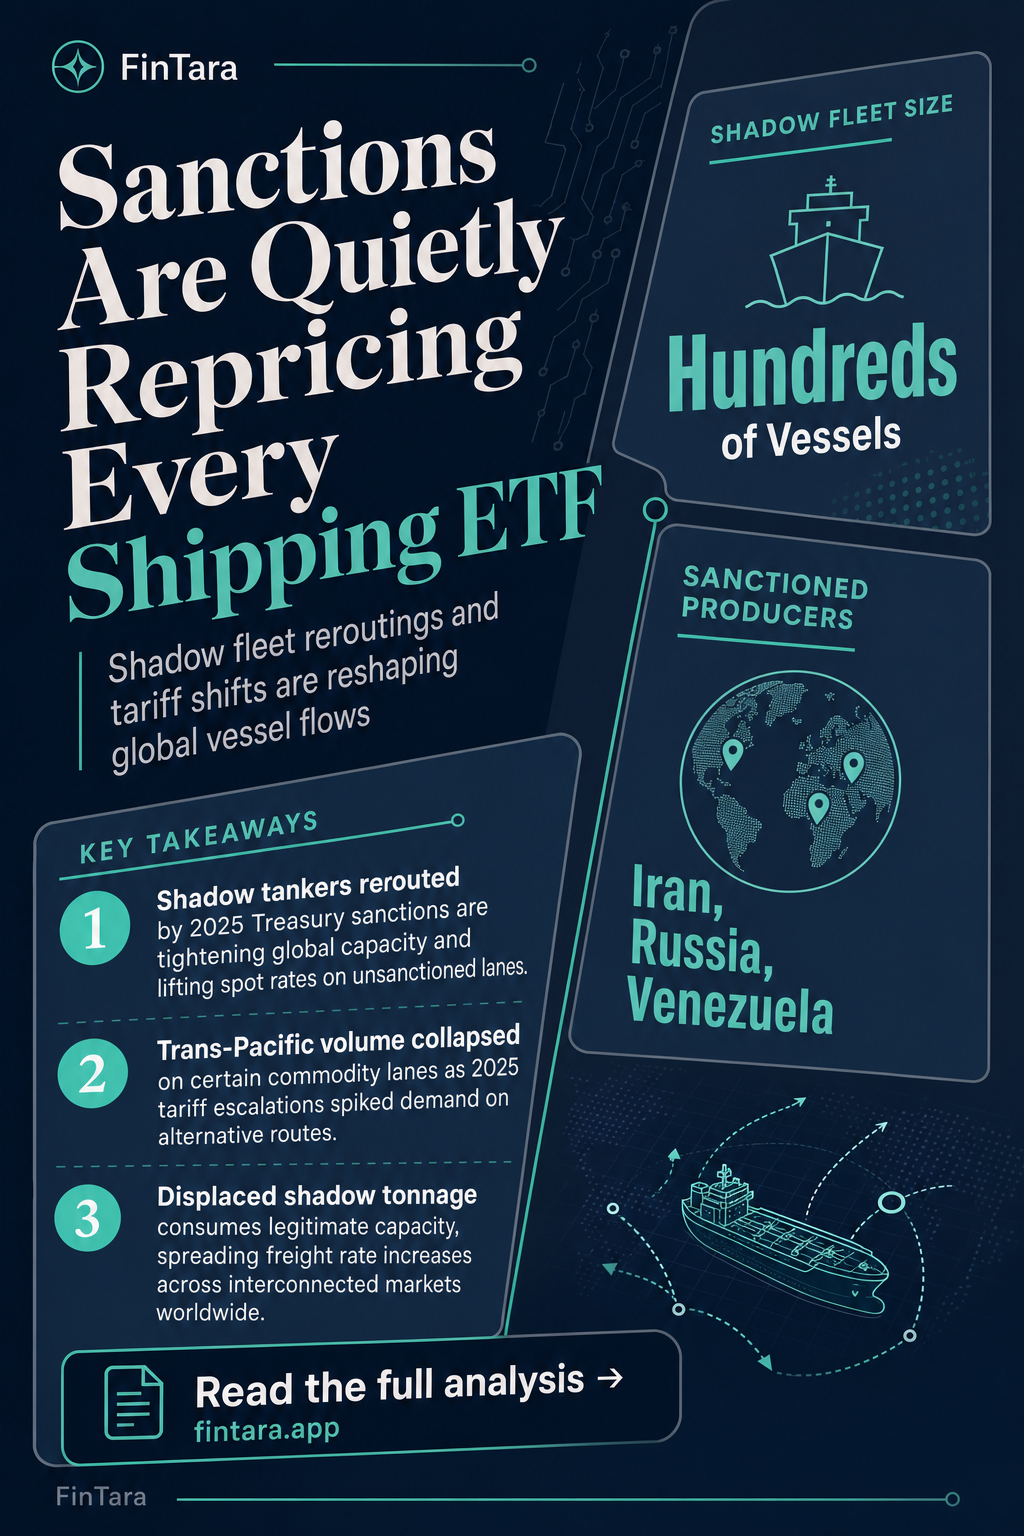
"Shadow fleet" sounds like a niche enforcement problem. It isn't.
Estimates suggest several hundred vessels operate outside Western insurance and registration systems — tankers that carry Iranian, Russian, and Venezuelan crude without paper trails that connect them to sanctioned parties. The U.S. Treasury has been systematically targeting the financial nodes that keep this fleet moving: the Chinese teapot refineries that buy the oil, the intermediaries who arrange the insurance, and the ports that provide service.
When one of those nodes gets hit, the vessel doesn't disappear. It reroutes.
That rerouting is what matters to cargo operators, because shadow tankers displace legitimate tonnage across interconnected markets. A tanker barred from East Asian ports burns longer routes to alternative buyers. That consumes capacity. Spot rates on corridors that seemed unaffected by sanctions tighten — not because those lanes are sanctioned, but because the displaced volume is competing for the same ships.
This is the mechanism that standard freight reporting misses. The sanctions don't just hurt the targeted operators. They alter the capacity math for everyone.
How Tariff Shocks and Sanctions Combined to Scramble Lane Demand in 2025
 Investors analyzing shipping ETF data on multiple monitors in a modern office — Photo by AlphaTradeZone on Pexels
Sanctions weren't the only supply-side pressure in 2025. Tariff escalation between the U.S. and China collapsed Trans-Pacific volume on certain commodity lanes while simultaneously flooding others as importers front-loaded orders ahead of scheduled rate increases.
The pattern that emerged was a capacity mismatch rather than a capacity shortage. Eastbound Trans-Pacific lanes saw pronounced demand spikes in Q1 2025 as importers pulled forward shipments — then abrupt demand cliffs as tariff schedules hit. Carriers that repositioned vessels to capture the spike found themselves overexposed when demand reversed.
Asia-Europe was a different story. With some Trans-Pacific business rerouting through indirect corridors to minimize tariff exposure — transshipment through Southeast Asian hubs has increased — the Asia-Europe corridor faced a different capacity allocation than carriers had planned for in late 2024. Ships follow profitable cargo. When cargo flow shifts faster than deployment decisions, you get pockets of rate volatility that look chaotic from the outside but follow a logic once you map the incentives.
The key variable isn't the tariff rate itself. It's the speed at which it changes. Fast tariff moves cause large, sudden routing shifts. Carriers can't redeploy assets overnight. That lag is where freight rates spike or collapse.
When the Thesis Breaks: Enforcement Without Effective Chokepoints
 Financial trader examining vessel route maps and logistics charts on a laptop — Photo by AlphaTradeZone on Pexels
The case for sanctions materially disrupting shadow fleet operations depends on one assumption: that the U.S. can actually apply pressure at the relevant chokepoints.
That assumption has limits. The shadow fleet doesn't clear U.S. financial infrastructure for most of its transactions. A tanker carrying Iranian crude to a Chinese teapot refinery, insured by a non-Western entity, and flagged in a country with no bilateral enforcement agreement — that vessel is largely outside the reach of OFAC unless it touches a dollar-denominated transaction or a port with U.S. jurisdiction.
Secondary sanctions create pressure on third-party banks and firms, but enforcement is uneven. Chinese financial institutions have shown willingness to absorb reputational risk rather than cut Iranian trade flows entirely. The teapot refineries targeted by Treasury in 2025 faced genuine pain — but the crude still moved. It found different intermediaries. Slightly less efficient, slightly more expensive, but not stopped.
This is the ceiling on sanctions as a supply-side mechanism. They raise costs and increase friction. They don't eliminate the flow. Prices adjust, routes adapt, and the shadow fleet finds workarounds — often within weeks. Anyone modeling 2025-2026 shipping rates on the assumption that Treasury enforcement produces a step-change in sanctioned oil supply is likely overstating the effect.
The more durable impact is geographic: specific ports and corridors become de facto no-go zones for mainstream carriers, reducing effective capacity on those routes even if the crude itself still moves through shadow channels. That's a friction story, not an elimination story.
Reading the Actual Vessel Data Before Making a Trade Decision
 Office desk with shipping ETF charts showing 2025 sanctions impact on vessel flows — Photo by AlphaTradeZone on Pexels
Freight rate indices are a lagging indicator. Vessel position data is faster.
Platforms like MarineTraffic and Kpler track AIS (Automatic Identification System) signals from commercial vessels in near-real time. When a vessel goes "dark" — disabling its AIS transponder — that's a shadow fleet signal. A cluster of dark AIS readings near a sanctioned export terminal, combined with satellite imagery showing vessel activity, is the ground truth that precedes the rate data by days or weeks.
For equity investors tracking shipping names — Zim, Hapag-Lloyd, Danaos, or liner-adjacent plays — this data tells you whether capacity is actually tightening on the lanes those carriers serve, or whether the rate spike is a short-term imbalance that resolves quickly. Rate spikes driven by genuine capacity removal (vessels permanently rerouted away from sanctioned corridors) are more durable than spikes driven by temporary front-loading demand.
One signal worth watching in Q2 2026: Red Sea routing is still not normalized. A significant share of Asia-Europe cargo continues taking the Cape of Good Hope route, adding roughly 10–14 days of transit time and absorbing effective vessel capacity. That capacity absorption is structural until the security environment in the Strait of Bab-el-Mandeb improves. Carriers pricing Asia-Europe freight are building that into their rates — and it's a different dynamic than a sanctions-driven corridor change.
The practical framework: before acting on a freight rate headline, check whether the capacity driver is sanctions enforcement, geopolitical rerouting, or demand timing. Each has a different duration and a different equity implication.
FAQ
Do U.S. sanctions actually reduce the volume of oil Iran exports?
The evidence is mixed. Secondary sanctions increase costs and complexity — insurance, intermediary fees, and acceptable buyers all narrow. But Iranian crude exports in 2024 remained elevated despite enforcement pressure, partly because Chinese teapot refineries absorbed discounted barrels. Sanctions appear to compress the price Iran receives more than the volume it ships.
Which shipping companies are most exposed to shadow fleet competition?
Tanker operators on Middle East and Russian crude routes face the most direct competition. Companies like Frontline and Ardmore Shipping operate in markets where shadow vessels take cargo that would otherwise go to legitimate fleets. Dry bulk and container carriers face indirect effects through capacity displacement and rerouting costs.
What does AIS dark activity actually signal for freight rates?
A vessel going dark near a sanctioned load port usually signals shadow fleet activity. When clusters of dark AIS events correlate with crude price discounts at that terminal, it confirms illicit flow without OFAC-compliant counterparties. Mainstream carriers can't touch that cargo — which concentrates compliant demand on fewer vessels and tightens spot rates.
How long does the Cape of Good Hope rerouting add to Asia-Europe transit?
Roughly 10–14 days versus the Suez Canal route. That transit extension effectively removes a portion of fleet capacity from the global pool — more ship-days required per voyage means fewer available vessels at any given time. In Q1 2025, analysts estimated this absorbed somewhere between 10–15% of effective Asia-Europe container capacity, though that figure varies by ship class and speed.
Is the 2025 tariff-driven demand spike in Trans-Pacific shipping sustainable?
No. Front-loaded demand pulls future orders into the present — it doesn't create new demand. The Q1 2025 import surge ahead of tariff deadlines was followed by a volume cliff as inventory buffers filled. Carriers that repositioned tonnage for the spike were then caught with overcapacity on those lanes. Rate normalization on Trans-Pacific typically follows within two to three quarters after a front-loading event.
Which equity sectors feel this first when shadow fleet disruptions hit?
Compliant tanker operators benefit from tighter legitimate capacity — higher spot rates when shadow tonnage exits a route. Petrochemical importers and refiners that depend on price-advantaged crude see margins compress when the supply they relied on becomes harder to source. U.S.-listed energy refiners with Middle East crude exposure are worth watching for margin signals before rate data catches up.
The real edge in shipping analysis isn't the freight rate index — it's knowing whether the capacity driving that rate is structural or temporary. Sanctions raise friction. Tariffs compress and then reverse demand. Neither is a clean trend. The map changes faster than most equity models update.