
A trade flow dashboard for retail investors is useful when it separates market pressure from market noise. The edge is not seeing more blinking panels. It is knowing which prints, volume bursts, heatmaps, and catalysts deserve attention. This article adds the missing condition: trade flow fails when the dashboard shows activity without latency, source quality, and context. Fast data without interpretation just makes overtrading feel professional.
Retail Traders Confuse Trade Flow With a Buy Signal
Trade flow sounds more precise than it is.
That is the trap.
For retail investors, trade flow means visible pressure across price, volume, orders, options activity, blocks, breadth, and news. It is not one feed. It is a stitched picture of demand and supply.
Order flow is narrower. It tracks how orders hit bids and offers. Options flow tracks activity in listed contracts. Volume flow tracks participation in the stock itself. Dark pool prints show off-exchange transactions after they appear.
None of those prove intent.
A large block can be accumulation. It can also be hedging, rebalancing, risk reduction, or a dealer cleaning up exposure. The tape shows that something happened. It rarely explains why.
That distinction matters because retail traders often treat visibility as confirmation.
A dashboard can show a stock turning green on rising volume. It can show a heatmap improving. It can show a catalyst calendar lighting up. That still does not make the trade asymmetric.
The missing layer is context.
A volume spike after earnings is different from a volume spike during a quiet session. A block trade near the low is different from one printed after a vertical rally. Options activity before a catalyst is different from options activity after the move.
Trade flow is evidence. It is not instruction.
TradingView says it is used by 100 million traders and investors. That scale matters because dashboards have become retail infrastructure, not niche trading toys.
The problem is obvious. A crowded interface can make a weak signal feel institutional.
Retail investors do not need more panels. They need fewer false permissions.
A good trade flow dashboard does one job. It helps you ask whether price is moving with sponsorship, exhaustion, or disorder.
That is a decision filter, not a trading system.
This is where shipping and trade-flow analysis has a useful lesson. Sanctions changed shipping ETF behavior in ways simple price charts missed why oil sanctions reshaped shipping etfs 2024. The signal was not one print. It was the pressure behind the print.
Retail equity dashboards should be judged the same way.
The useful question is not whether buyers appeared. The useful question is whether the buying changed the setup.
If it did not, the dashboard is decoration.
TradingView and Alpha Terminal Show the Split Between Coverage and Interpretation
 TradingView draws retail investors through free broad market coverage, while Alpha Terminal emphasizes interpretive depth over wide-ranging data access. — Photo by Jakub Zerdzicki on Pexels
The market has split into two product types.
One sells breadth. The other sells interpretation.
TradingView sits on the breadth side. It presents itself as a place to track all markets. It also advertises a free starting option with “$0 forever” and no credit card needed.
That matters. Free access lowers the barrier for retail investors. It also increases the temptation to confuse access with advantage.
A free dashboard can be excellent for watchlists, charts, alerts, market summaries, and cross-market awareness. It can help a retail investor see when a stock stops trading like its sector.
That is useful.
But the free price does not answer the serious questions. Data delay, exchange coverage, alert speed, and historical depth matter more than the homepage promise.
Alpha Terminal sits closer to interpretation. Its GitHub description calls it a retail-investor research dashboard. It includes AI agent panels, stock scoring, a live market dashboard, an S&P 500 heatmap, a catalyst calendar, and a real-fill options backtester.
That stack is more interesting than a generic app roundup.
It attempts to connect flow, catalysts, scoring, and strategy testing. That is the right ambition. Retail investors need a workflow, not another chart window.
But the evidence also demands restraint.
The Alpha Terminal repository shows 8 stars and 1 fork. It also shows 142 commits. That suggests active development, not broad validation.
Small adoption does not make a tool bad. It does make the output less proven.
This is the dashboard problem in miniature.
Coverage and interpretation are different products. A platform can show everything and explain little. Another can explain more while still lacking battle-tested adoption.
Retail investors should not buy the story. They should inspect the plumbing.
The first question is latency. A delayed block print is history, not flow. The second question is source quality. A clean feed beats a noisy composite.
The third question is asset coverage.
If your portfolio is mostly large-cap US stocks, an S&P 500 heatmap helps. If you trade smaller names, a big-index map can hide the real action.
The fourth question is alert design.
Alerts should tell you when something changes. They should not reward staring.
The fifth question is whether the dashboard separates signals from execution. Alpha Terminal states “signals only — no trading execution.” That boundary is healthy.
Execution inside the same interface can reduce friction. It can also reduce thinking.
A dashboard should slow bad trades and speed good analysis.
Most tools do the opposite.
Delayed Prints Break the Illusion of Institutional Visibility
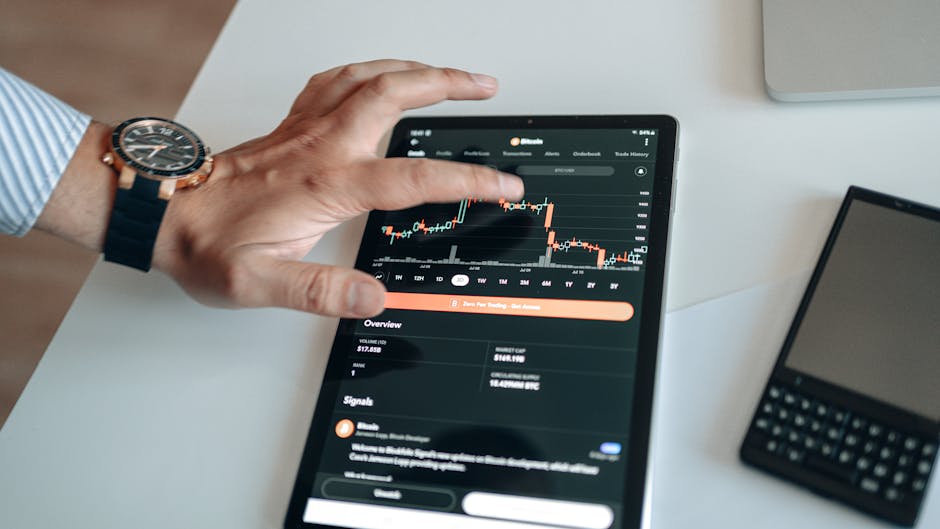 Delayed prints shatter the illusion of real-time institutional visibility by arriving after the decision window has closed. — Photo by AlphaTradeZone on Pexels
Retail investors can see institutional-style footprints.
They cannot see institutional intent in real time.
That is the hard limit.
Dark pool prints are the cleanest example. They sound secretive. In practice, they often arrive after the useful decision window has moved.
A print can confirm that size traded. It does not confirm that a new buyer is building a position. It does not reveal whether the other side was forced, passive, hedged, or finished.
Block trades have the same problem.
A large transaction can look bullish because size appeared. But size often appears when liquidity is available. That can happen near the end of a move, not the start.
Options flow has another failure mode.
Retail traders love unusual options activity because it looks informed. Sometimes it is. Often it is a hedge, spread, roll, closing trade, or dealer-related adjustment.
The dashboard may flag the print. The strategy behind it stays hidden.
This is where the dashboard becomes dangerous.
It gives retail investors institutional aesthetics without institutional context.
A heatmap can show broad green. That does not show whether leadership is expanding or narrowing. A catalyst calendar can show dates. It does not show whether the event is already priced.
An AI score can rank stocks. It cannot remove regime risk.
But here's the problem.
Trade flow dashboards make weak evidence feel urgent.
Urgency is expensive.
The failure condition is not bad data alone. It is data that arrives without a required waiting rule.
A retail investor needs a rule before the signal appears. Otherwise the dashboard becomes a slot machine with charts.
For example, a flow alert should require price confirmation. It should require volume context. It should require a stop level that exists before entry.
No sourced fact is needed for that. It is basic process discipline.
The same logic applies outside single stocks. Shipping ETFs in 2024 showed how visible price movement can lag deeper trade pressure why oil sanctions reshaped shipping etfs 2024. The headline move was not enough.
Retail dashboards break when they collapse cause, catalyst, and confirmation into one green alert.
The market does not pay for seeing activity. It pays for understanding when activity changes odds.
The dashboard should earn attention only when it changes the decision.
A Useful Dashboard Starts With Latency, Source Quality, and Refusal Rules
 Latency, source quality, and refusal rules form the practical foundation for evaluating any retail investor dashboard. — Photo by Jakub Zerdzicki on Pexels
The buying criteria are simple.
Most retail investors ignore them.
Start with latency. Real-time or near-real-time data matters when the strategy depends on timing. Delayed data can still help swing traders. It is weaker for intraday decisions.
Then check sources.
A dashboard should disclose what it measures. Exchange prints, consolidated volume, options activity, news feeds, heatmaps, and calendars are not interchangeable.
If the vendor hides the source, treat the signal as commentary.
Next comes visualization quality.
The best dashboard does not show more. It compresses noise into fewer decisions. Heatmaps should reveal leadership. Volume panels should show abnormal participation. Alerts should separate routine movement from genuine change.
Asset coverage matters next.
TradingView presents market summary coverage across major indices, futures, and economic indicators. That breadth helps investors track context across major markets.
But breadth has a cost.
Too much coverage creates false relevance. A retail stock trader does not need every macro panel open. A dashboard should match the positions actually traded.
Broker integration is optional. Process integration is not.
A trader can use a dashboard outside the brokerage account. That is often better. It creates a pause between signal and execution.
Cost comes last, not first.
TradingView’s free starting tier is useful. It lets retail investors build a basic workflow before paying for speed, depth, or more alerts.
Free is enough for learning. It is not always enough for fast trading.
The practical checklist is blunt:
| Criterion | What To Check | Why It Matters |
|---|---|---|
| Latency | Real-time, near-real-time, or delayed | Timing changes signal value |
| Data sources | Exchange, options, news, calendar, heatmap | Source quality shapes trust |
| Alerting | Custom triggers, not generic popups | Bad alerts cause overtrading |
| Visualization | Breadth, volume, price, catalysts together | Context beats isolated prints |
| Coverage | Stocks and indices relevant to your book | Irrelevant panels create noise |
| Execution boundary | Signals separate from trading | Friction protects discipline |
| Cost | Free tier, paid data, premium alerts | Price must match use case |
The refusal rules matter more than the feature list.
Do not use a trade flow dashboard when the spread is wide, the stock is illiquid, the catalyst is unclear, or the signal conflicts with trend.
Do not use it when position size is already decided by emotion.
Do not use it to justify averaging down.
That last one matters.
Flow can look supportive while a stock remains structurally weak. A few green prints do not fix declining leadership, broken trend, or bad earnings reaction.
The dashboard should answer one question before any trade.
Is this signal strong enough to change the plan?
If not, ignore it.
Retail Investors Should Build a Flow Stack, Not Chase a Terminal
The right setup is not one magic terminal.
It is a flow stack.
Use one platform for charts and alerts. Use one source for catalysts. Use one panel for breadth. Use one journal to record why the signal mattered.
That sounds slower. It is supposed to.
A retail investor does not beat faster firms by becoming slightly faster. The advantage is choosing fewer trades with cleaner conditions.
The dashboard should support that.
A practical workflow starts with the watchlist. Limit it to stocks or ETFs already worth owning or trading. Random flow alerts on random tickers are noise with a ticker symbol.
Then define the trigger.
A useful trigger could be unusual volume with price holding above a prior level. It could be sector leadership improving with the stock near a breakout. It could be a catalyst approaching with volatility already priced down.
Keep the language specific.
“Strong flow” is not a trigger. “Volume expands while price holds above the prior breakout level” is closer.
Then define invalidation.
If the signal fails, the trade should have a clear exit or no entry. A dashboard that helps with entry but not invalidation is incomplete.
Then record the outcome.
Not every signal needs a backtest. But every repeated setup needs evidence. If a dashboard produces alerts that cannot be reviewed, it is entertainment.
Alpha Terminal’s real-fill options backtester points in the right direction. Testing with realistic fills matters because quoted prices often flatter a strategy.
The exact result still depends on the setup. No dashboard removes that work.
Retail investors should also separate timeframes.
Intraday flow can help with entries. Daily breadth can help with risk. Catalyst calendars can help avoid surprise. AI scoring can help rank attention.
Mixing those into one buy decision is where errors start.
A dashboard should reduce confusion between “now” and “worth owning.”
Those are different decisions.
The strongest use case is not prediction. It is triage.
A trade flow dashboard can tell a retail investor which names deserve review now. It can show when a quiet watchlist name starts behaving differently. It can flag when market breadth disagrees with index strength.
That is actionable without pretending to be clairvoyant.
The weakest use case is copying flow.
Retail investors who chase every unusual options alert are not trading like institutions. They are providing liquidity to people with better context.
The tool is not the edge.
The edge is the refusal rule attached to the tool.
FAQ
What is a trade flow dashboard for retail investors? It is a research interface that combines price, volume, orders, options activity, catalysts, heatmaps, and alerts. Its job is to show market pressure faster than a basic brokerage screen.
How is trade flow different from order flow and options flow? Trade flow is broader. Order flow focuses on bids, offers, and executed orders. Options flow tracks listed options activity. Trade flow combines both with volume, breadth, catalysts, and price behavior.
What features should a retail investor look for? Start with latency, data sources, alert quality, visualization, asset coverage, and cost. Broker integration matters less than signal discipline. Execution friction can protect decision quality.
Can retail investors see institutional buying and selling activity? They can see footprints, not intent. Blocks, dark pool prints, and options trades show that size moved. They rarely reveal why it moved.
Are free trade flow dashboards accurate enough for day trading? Free dashboards can help with charts, watchlists, and basic alerts. Fast day trading needs better latency and cleaner data. Free access is useful. It is not automatically execution-grade.
What are the risks of using trade flow signals? The main risks are delayed data, false positives, survivorship bias, and overtrading. The dashboard can make activity feel important when the setup has not improved.
Should a dashboard replace fundamental research? No. It can improve timing and attention. It cannot decide whether a business deserves capital. Flow is a market behavior signal, not a full investment case.
When should a retail investor ignore trade flow? Ignore it when the stock is illiquid, the spread is wide, the catalyst is vague, or the trend is broken. Also ignore it when the signal only confirms a trade already driven by emotion.
Trade flow is useful when it filters decisions. It is costly when it flatters impulse.