
Monitoring the Federal Funds Rate, CPI inflation, or GDP growth does not give retail investors a meaningful edge in portfolio construction. The data is public, already priced into markets, and reacts faster than you can rebalance. A retail portfolio built on quality businesses with strong cash flow will outperform a macro-timing approach over any 10-year period. The real edge is not in predicting the macro economy, but in owning companies that can survive and thrive through any macro environment. This matters because most retail investors waste time tracking indicators that offer no actionable signal for their specific holdings.
What most retail investors get wrong about macro data
The mistake is treating macro indicators as buy or sell signals for your portfolio. When the 10-year yield hits 4.25% or unemployment rises to 4.1%, the instinct is to react. This is backward. Macro data describes the economy at a point in time; it does not tell you whether a specific stock is mispriced or whether your portfolio is appropriately allocated. The market digests these numbers instantly. By the time you read a headline about CPI hitting 3.0% year-over-year, algorithmic traders have already moved prices based on the futures market. Your reaction is stale.
The deeper error is correlation confusion. Yes, equities tend to fall when interest rates rise sharply. But a portfolio of high-quality companies with pricing power and low debt can perform well even in a rising-rate environment. The indicator does not dictate the outcome; the business quality does. Retail investors who anchor their decisions to macro prints often sell good companies at the wrong time, locking in losses because a number scared them, not because the thesis broke.
The evidence from historical portfolio performance
 A close-up of a trading screen displaying market graphs, highlighting the public data already priced into markets. — Photo by AlphaTradeZone on Pexels
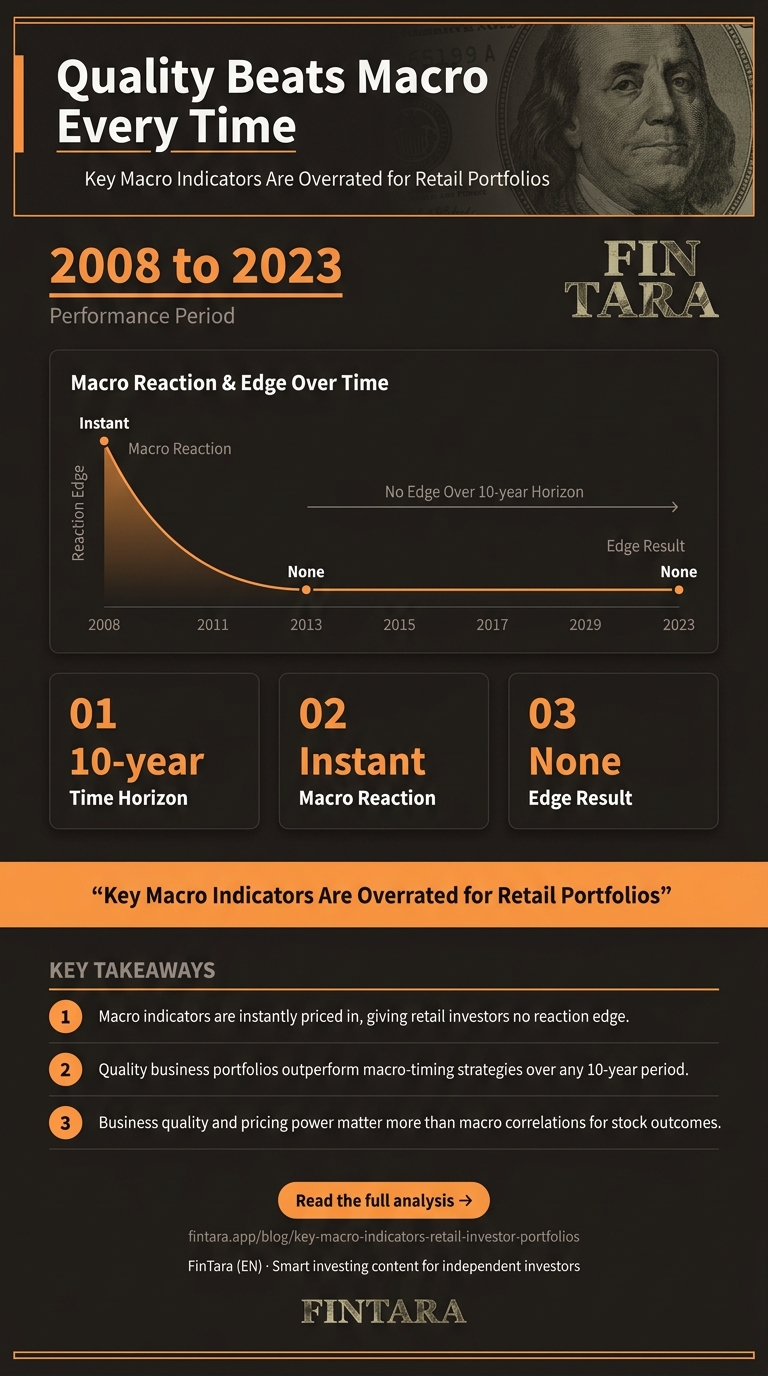
Consider the period from 2008 to 2023. An investor who tried to time the macro environment would have had to navigate the financial crisis, the European debt crisis, the 2018 sell-off, and the 2020 crash. Each event was preceded by shifting macro signals—yield curve inversions, rising unemployment, falling GDP. Yet a simple buy-and-hold portfolio of quality businesses recovered and delivered strong returns. The evidence points to a clear pattern: macro indicators are noise for long-term equity holders.
Let’s be clear: this does not mean macro data is useless. It means its utility is limited for retail portfolio construction. The Federal Funds Rate at 5.25%-5.50% as of July 2024 signals a restrictive policy stance. But that does not automatically mean you should sell equities. It means you should evaluate whether your holdings can service debt, maintain margins, and grow earnings in that environment. The indicator is a background check, not a trigger.
When macro timing breaks down — failure conditions
 A financial graph on a monitor showing stock trends, representing how macroeconomic data reacts without giving an edge. — Photo by AlphaTradeZone on Pexels
Macro-based strategies fail in three specific scenarios. First, when data is contradictory. For example, real GDP growth of 1.4% annualized in Q1 2024 suggests slowing expansion, yet unemployment remains low at 4.1% and corporate earnings are resilient. Which signal do you follow? The market often resolves this by looking past the noise to forward earnings, which macro data does not predict well.
Second, when you miss the recovery. The fastest gains in equity markets often occur in the first few months after a macro-driven sell-off. If you wait for macro confirmation—like a quarter of negative GDP or a sustained drop in unemployment—you are already late. The 2020 recovery priced in the rebound months before unemployment peaked. A retail investor who sold based on March 2020 macro data missed the 70%+ rally that followed.
Third, when you overfit historical patterns. Every recession is different. The 2008 crisis was driven by housing and leverage. The 2020 crisis was driven by a pandemic and supply shock. Relying on past macro correlations to predict the next event is fragile. The failure condition is assuming that because X macro indicator preceded a past downturn, it will do so again. The data does not support that reliability for retail decision-making.
What to actually do — build a macro-resilient portfolio
Stop trying to time macro shifts. Instead, use macro indicators as a checklist for portfolio quality. When the Federal Funds Rate is at 5.25%-5.50%, you should ask: do my holdings have manageable debt and pricing power? When CPI is at 3.0%, you should ask: can these companies pass on cost increases without losing volume? This is a filter, not a trigger.
Use tools to track macro data without reacting to every print. Set up a Google News alert for “CPI” and “Fed meeting,” but do not act on every headline. Review the data quarterly, not monthly. This aligns with earnings cycles and prevents overtrading. For portfolio construction, focus on metrics that matter: revenue growth, profit margins, free cash flow yield, and debt-to-equity ratios. These are company-specific and controllable, unlike macro prints.
The inversion rule: When macro data is strong—low unemployment, rising GDP, stable inflation—do not automatically increase equity exposure. This is when valuations are often stretched. Instead, use macro strength to review position sizing and trim winners that have become overextended. When macro data is weak, do not panic-sell. Use it as a signal to hunt for quality companies trading at discounts due to macro fear, not business failure.
FAQ
What are the most important macroeconomic indicators for retail investors?
CPI inflation, Federal Funds Rate, unemployment, GDP growth, and the 10-year yield matter most. But their value is as background context, not direct signals. Use them to assess portfolio risk, not to time buys or sells.
How does inflation affect my stock and portfolio?
Inflation erodes purchasing power and can pressure margins. Companies with pricing power—like dominant brands or essential services—can pass costs to customers. Focus on businesses with low debt and strong cash flow to withstand inflationary periods.
What tools can I use to track macro indicators as a retail investor?
Set Google News alerts for key terms, use the Federal Reserve website for rate decisions, and follow the BLS for employment and CPI data. Calendars like Investing.com’s economic calendar help you know when data releases happen.
How often should I review macro indicators for portfolio adjustments?
Review macro data quarterly, aligned with your portfolio rebalancing schedule. Daily or weekly checks lead to overreaction and unnecessary trading. Focus on trends over single prints.
Can retail investors use macro data to time the market?
No. Macro data is public and priced in quickly. Retail investors lack the speed and tools to act on macro signals before institutions. Focus on business quality instead.
What historical examples show retail portfolios impacted by macro shifts?
The 2008 financial crisis and the 2020 pandemic sell-off are clear examples. In both cases, portfolios with quality businesses recovered faster than those that sold based on macro fear. The lesson: resilience beats timing.
Does a high unemployment rate mean I should sell equities?
Not necessarily. Unemployment is a lagging indicator. By the time it rises, markets may have already bottomed. Evaluate your holdings based on their ability to survive a slowdown, not on the unemployment print alone.