
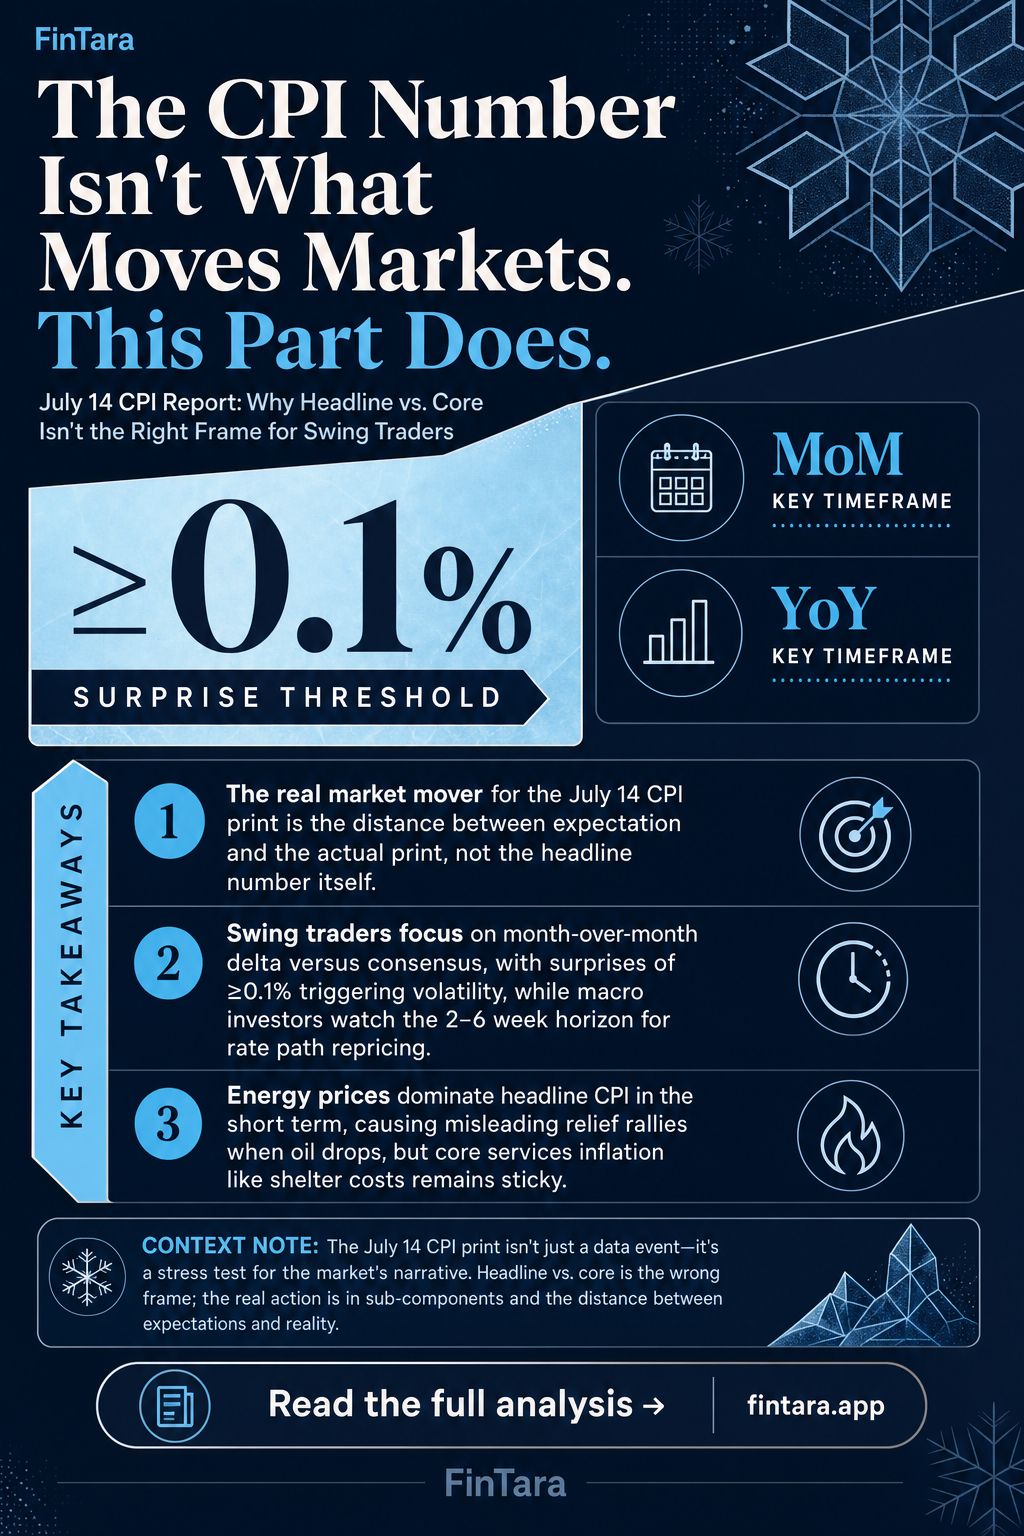
The July 14 CPI print isn't just a data event — it's a stress test for whatever narrative the market has been pricing in. Most coverage tells you what to watch. This post explains why headline vs. core is the wrong frame for swing traders, where the real divergence trades live inside the report's sub-components, and which sectors get re-priced first when the number surprises in either direction. The deciding factor isn't the headline figure. It's the distance between expectation and print.
Quick Comparison: Two Ways to Read the CPI Report
| Dimension | Macro Investor | Swing Trader |
|---|---|---|
| Relevant number | Core CPI YoY | MoM delta vs. consensus |
| Time horizon | 2–6 weeks post-print | 1–5 days around print |
| Key concern | Fed rate path repricing | Volatility expansion, gap fills |
| Sectors watched | Rate-sensitive: utilities, REITs proxy — financials, housing | XLY, XLK, XLE — directional movers |
| Risk managed | Portfolio duration | Position size before release |
| The miss that matters | Core above 3% YoY | Any surprise ≥ 0.1% vs. forecast |
These aren't two types of investors. They're two different questions — asked of the same number.
Why the Headline Number Misleads Both Groups

Energy prices dominate headline CPI in the short term. When oil drops, headline CPI softens. Markets react as if inflation is under control. Then core CPI — which excludes food and energy — holds flat or rises, and the relief rally reverses.
This is the pattern that has burned portfolios repeatedly through 2023 and 2024. Traders celebrated falling headline prints while core services inflation, particularly shelter costs, remained sticky. The Fed kept saying this. Markets kept not believing it until the next print proved it.
For the July 14 report, the relevant question isn't "did inflation fall?" It's "what drove the move?" A declining headline carried by energy tells you almost nothing about Fed policy. A declining core, especially in shelter, changes the calculus meaningfully.
Read the BLS breakdown, not the headline. It takes 90 seconds. The sub-component table is on the first page of the release. june cpi report preview why investors are watching tomorrow
Where the Macro Investor Has the Edge — Reading the Rate Signal
 The June CPI report tests the market's prevailing inflation narrative. — Photo by Kaushal Moradiya on Pexels
Long-horizon investors aren't trying to catch the first 30 minutes of volatility. They're trying to answer one question: does this print change the Fed's rate path?
A single CPI print almost never shifts Fed policy on its own. The Fed has made this explicit repeatedly — it watches sequences, not data points. One good print after several hot ones won't trigger a rate cut. One bad print after a string of cool ones won't trigger a hike. The 2025–2026 environment reinforced this: the Fed held rates steady across multiple prints that individually looked like inflection points.
What changes the rate path is trend. Three consecutive softer core readings. Shelter deceleration sustained over a quarter. Services inflation finally responding to labor market cooling. When a CPI print fits into a pattern rather than breaks one, the macro investor acts.
The trade here isn't the day of release. It's the day after, when Fed funds futures reprice and the consensus note hits. Rate-sensitive sectors — financials, housing-adjacent names — often move more in the 48 hours after the print than during the initial reaction.
Position before the trend confirms, not during the spike. The volatility around the release is noise for this time horizon.
Where the Swing Trader Has the Edge — Working the Gap Between Expectation and Print

Consensus estimates for CPI come from a small group of bank economists. Markets price those estimates in before the release. The trade isn't the number itself — it's the spread between the number and what the market already believed.
A print of 0.2% MoM when consensus was 0.3% is a soft miss in the other direction. Markets reprice immediately. Sectors that were sold down into the report on inflation fear — technology, discretionary, high-multiple names — often recover sharply. The swing trader is positioned for that recovery before it starts.
The same logic works the other way. A print of 0.4% when the street expected 0.2% compresses multiples fast. Rate-sensitive longs get stopped out. Sector ETFs like XLK and XLY lead the move down.
The edge isn't prediction. It's knowing which sectors react first and which lag. Energy (XLE) often leads on headline surprises. Technology (XLK) leads on core surprises. Discretionary (XLY) follows both, but with a delay. A swing trader with sector ETF positions around the release has tighter reaction windows than a single-stock trader. may gdp release what investors and swing traders should wat
One risk that never gets discussed: the VIX doesn't always spike on a bad print if the market already priced in the downside. A "bad" print that matches fears can actually reduce implied volatility — and positions sized for a big move go flat.
The Hidden Trade-Off: Speed vs. Conviction
Macro investors sacrifice speed to get conviction. Swing traders sacrifice conviction to get speed. Neither is wrong. But many retail investors try to do both simultaneously — and pay the cost of each without capturing the benefit of either.
The error looks like this: a retail investor reads the CPI headline at 8:31 AM, reacts to the initial print, takes a position, and then watches the market reverse 20 minutes later when the core sub-components tell a different story. They were acting on the speed required for swing trading with the conviction level appropriate for macro investing. Neither framing protected them.
The fix isn't faster reflexes. It's deciding, before the release, which game you're playing.
If you're a macro investor: decide your thesis on the rate path before the print. Let the first 30 minutes of volatility settle. Read the components. Act on what the components mean for the next 45 days of Fed signaling, not the next 45 minutes of market reaction.
If you're a swing trader: size down before the release. The volatility window is real, but so is the risk of gap-and-reverse. Half-size into the report, full-size once the first 15-minute candle closes and direction is confirmed. Missing the first 1% to capture the next 3% is still a good trade.
What most retail investors actually do is hold full size through the release, react emotionally to the first move, and then freeze when the reversal comes. That's not swing trading. That's unmanaged exposure dressed up as a thesis.
How the July 14 Release Changes Existing Positions — Not Just New Ones
Most CPI coverage focuses on what to buy or sell around the print. The more important question for most retail investors is what to do with positions already held.
A hotter-than-expected print on July 14 doesn't just create new short opportunities. It changes the risk profile of existing long positions in rate-sensitive sectors. A utility position or high-growth tech name held into a hot CPI print suddenly has a different fundamental backdrop than it had the day before. The position wasn't wrong when entered. But the information set changed.
The practical question: at what CPI level does your long thesis break? Not "does the stock go down" — that's just price. "Does the reason I held this stock still hold?" If the thesis was built on rate cuts arriving in Q3 2026, and the July 14 print pushes that expectation to Q1 2027, the thesis changed. The stock may take weeks to reflect it. But you know now.
This is where investors with a written thesis have a structural advantage. The print either confirms or challenges a specific assumption. Investors without a written thesis react to price, not information.
may retail sales release what investors and swing traders sChoose Macro Framing If... / Choose Swing Framing If...
Choose the macro investor's approach if:
- Your holding period on current positions is 30 days or longer
- You care about where rates are in 6 months, not where futures are in 6 hours
- You want to use the print to rebalance sector exposure, not initiate new positions
- You don't plan to be watching a screen at 8:30 AM on July 14
Choose the swing trader's approach if:
- You have defined entry and exit levels set before the release
- You've sized down to half-normal position size going into the print
- Your thesis is directional on a specific sector ETF, not a macro forecast
- You accept that a gap-and-reverse could stop you out within the first hour
Neither approach fits if:
- You're planning to watch the number and then decide what to do
- You don't know what consensus is before the print drops
- Your current positions are full-sized and unhedged into the release
The report drops on July 14. The BLS has confirmed the schedule. The next two releases follow on August 12 and September 11 — enough time for a macro trend to become legible, and enough space between prints for a swing thesis to play out fully.
FAQ
What time does the July 14 CPI report drop, and where do you find it?
The BLS releases CPI data at 8:30 AM Eastern. The official release appears at bls.gov immediately at 8:30 — no paywall, no delay. Pre-market equity futures and sector ETFs begin repricing within seconds. Subsequent 2026 releases are scheduled for August 12 and September 11.
Is a 0.1% CPI miss actually significant enough to move markets?
Yes — in context. A 0.1% miss versus consensus is small in absolute terms, but markets price in the forecast. If consensus is 0.3% and the print is 0.2%, that's a full one-third undershoot. XLK and XLY have historically led the recovery in that scenario, often moving within the first 30 minutes.
What's the single most market-moving sub-component in recent CPI reports?
Shelter costs — the OER (Owners' Equivalent Rent) line — carry roughly one-third of the total CPI weight. When shelter deceleration finally shows up convincingly, core CPI falls structurally rather than temporarily. That's what the Fed and rate markets are watching most closely in Q2–Q3 2026.
Should you hold individual stocks through a CPI release, or switch to sector ETFs?
Sector ETFs reduce single-stock earnings risk. Around macro data events, XLK reacts to core CPI, XLE reacts to headline. Individual stocks add company-specific noise on top of the macro signal. For pure CPI-directional trades, sector ETFs give a cleaner expression with tighter spreads and high liquidity at 8:30 AM.
Does a soft CPI print guarantee a rally in tech stocks?
No. Soft CPI is a necessary but not sufficient condition. If valuations in tech are already pricing in rate cuts — as they were for stretches of 2024 — a soft print confirms what's already in the price. Markets need the surprise to move. A print that matches expectations often produces less movement than a 0.1% miss because the reaction was partially pre-traded.
How do you set a stop-loss on a position held through a CPI release?
The gap risk is real — markets can open several percent from the prior close after a large surprise. Standard stop-losses don't protect against gap opens; they execute at the next available price. The practical solution: reduce position size before the release rather than relying on a stop. Half-sizing into the print limits gap exposure without requiring you to exit the thesis entirely.