
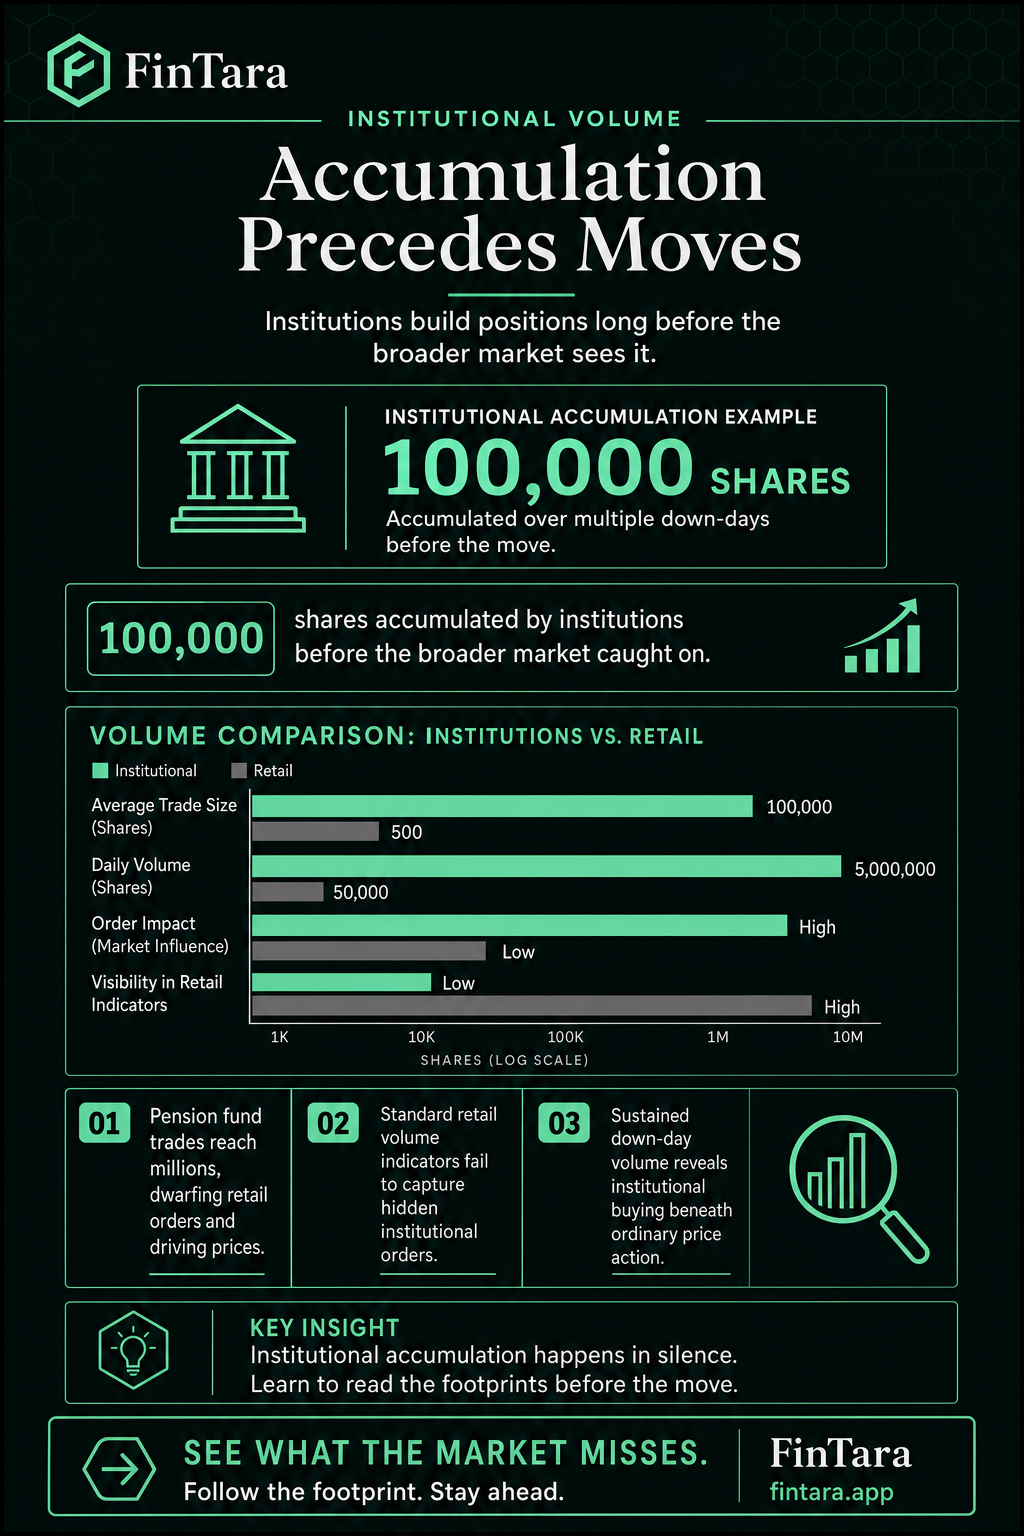
Institutions drive stock prices, not retail investors. A large retail investor may trade 100,000 shares, while pension funds, hedge funds, and sovereign wealth funds trade millions. This size gap means institutional volume accumulation precedes major price moves. Retail traders who track institutional buying patterns gain an edge, but most never look past daily volume bars.
The Size Gap That Explains Price Moves
Institutions are the main driver behind stock moves, not retail investors, according to a February 2024 analysis. Large retail investors may trade 100,000 shares, while institutional funds typically trade millions of shares per position.
Institutional investors include pension funds, hedge funds, sovereign wealth funds, and endowment funds managing vast capital pools. This volume disparity means institutional buying or selling pressure overwhelms retail order flow on any given day.
A stock rising on low retail volume often signals institutional accumulation that has not yet appeared in public filings.
Why the Retail Volume Signal Misleads Most Traders
 Retail volume signals overlook slow institutional accumulation, hiding buying beneath flat or declining prices. — Photo by RDNE Stock project on Pexels
Most retail platforms display total volume without distinguishing between institutional accumulation and distribution pressure. On-balance volume and accumulation indicators offer better signals but still miss the multi-month timeframe institutions operate within.
A large institutional investor may take several months or even years to accumulate shares without driving prices higher. This slow accumulation creates flat or slightly declining price action that looks bearish to retail traders.
The article highlights PLTR and CVNA as stocks exhibiting institutional accumulation patterns worth monitoring. Filtering for sustained volume increases on down days can reveal institutional buying hidden beneath ordinary price action.
The Structural Constraints That Create Retail Opportunities
 Retail traders can exploit institutional mandates and liquidity constraints by concentrating capital in high-conviction positions. — Photo by Kindel Media on Pexels
Institutional investors enjoy advantages such as extensive research teams, top-of-the-line software, and access to more information. Despite these advantages, institutions face structural constraints that retail traders do not encounter.
Institutions often have restrictive mandates, such as the number of stocks that the portfolio must own at any time. These mandates force institutions into over-diversification, limiting their ability to concentrate capital in high-conviction names.
An institution building a position cannot exit quickly without crashing the price, creating a lag retail traders can exploit. Retail traders face no such mandate constraints and can concentrate capital in fewer names with higher conviction.
How to Read Institutional Accumulation Without Premium Tools
A stock trading sideways on rising volume over weeks often signals institutional accumulation beneath the surface. Sustained volume on red days with minimal price decline suggests buyers are absorbing institutional-sized sell orders.
The February 2024 Zacks article by Andrew Rocco emphasized monitoring accumulation before breakouts occur, not after. Price advances on low volume followed by declines on high volume indicate distribution, the opposite of accumulation.
Tracking 50-day average volume against 10-day volume reveals whether accumulation pressure is building or fading. Quarterly 13F filings confirm institutional positions but lag real-time accumulation by up to 45 days.
Positioning Around Institutional Flow Without Chasing It
Entering after a breakout triggered by institutional accumulation often means buying near a local price top. The edge lies in identifying accumulation during the flat period before the breakout, not during the move itself.
Position sizing should account for the multi-month timeframe institutions require to complete their accumulation process. Retail traders watching PLTR and CVNA in February 2024 would have needed patience to capture the full institutional move.
Exit signals appear when volume rises on green days but price stalls, indicating institutional selling into retail demand. The strategy fails when traders mistake a short-term volume spike for sustained institutional commitment over multiple weeks.
FAQ
What is institutional volume accumulation?
Institutional volume accumulation is the process by which large funds build positions in a stock over weeks or months. These buyers include pension funds, hedge funds, and sovereign wealth funds. Because they trade millions of shares, their buying pressure eventually moves prices. The accumulation phase often appears as sideways price action with unusually high volume on down days.
How can I detect institutional accumulation in a stock?
Watch for sustained volume increases on down days with minimal price decline. This pattern suggests large buyers are absorbing sell orders without pushing prices higher. Track the 50-day average volume against recent 10-day volume. Rising averages with flat price action often precede breakouts. Avoid relying on total volume alone, which mixes institutional and retail flow without distinction.
Why do institutional investors drive stock prices more than retail?
Institutions trade millions of shares per position, while large retail investors may trade 100,000 shares. This size gap means institutional order flow overwhelms retail activity. When a pension fund or hedge fund accumulates a stock, the volume pressure eventually forces prices higher. Retail volume alone rarely generates enough demand to move a liquid stock.
What disadvantages of institutional investing can retail traders exploit?
Institutions face restrictive mandates requiring them to hold a specific number of stocks, forcing over-diversification. They cannot exit large positions quickly without crashing the price. A single institution may take months or years to build a position. Retail traders face no such constraints and can concentrate capital in fewer names with higher conviction and faster entry or exit.
Which stocks showed institutional accumulation in February 2024?
A February 2024 Zacks article by Andrew Rocco highlighted PLTR and CVNA as stocks exhibiting institutional accumulation patterns. The analysis emphasized monitoring these names for sustained volume increases on down days. Both stocks showed characteristics of institutional buying beneath flat price action. The article was published on February 6, 2024, via Nasdaq and Yahoo Finance.
How should retail investors use institutional accumulation data in their strategy?
Use accumulation signals to identify entry points during flat price periods, not after breakouts. Position sizing should reflect the multi-month timeframe institutions require to complete accumulation. Watch for volume rising on green days with price stalling as an exit signal. Avoid confusing short-term volume spikes with sustained institutional commitment over multiple weeks.