
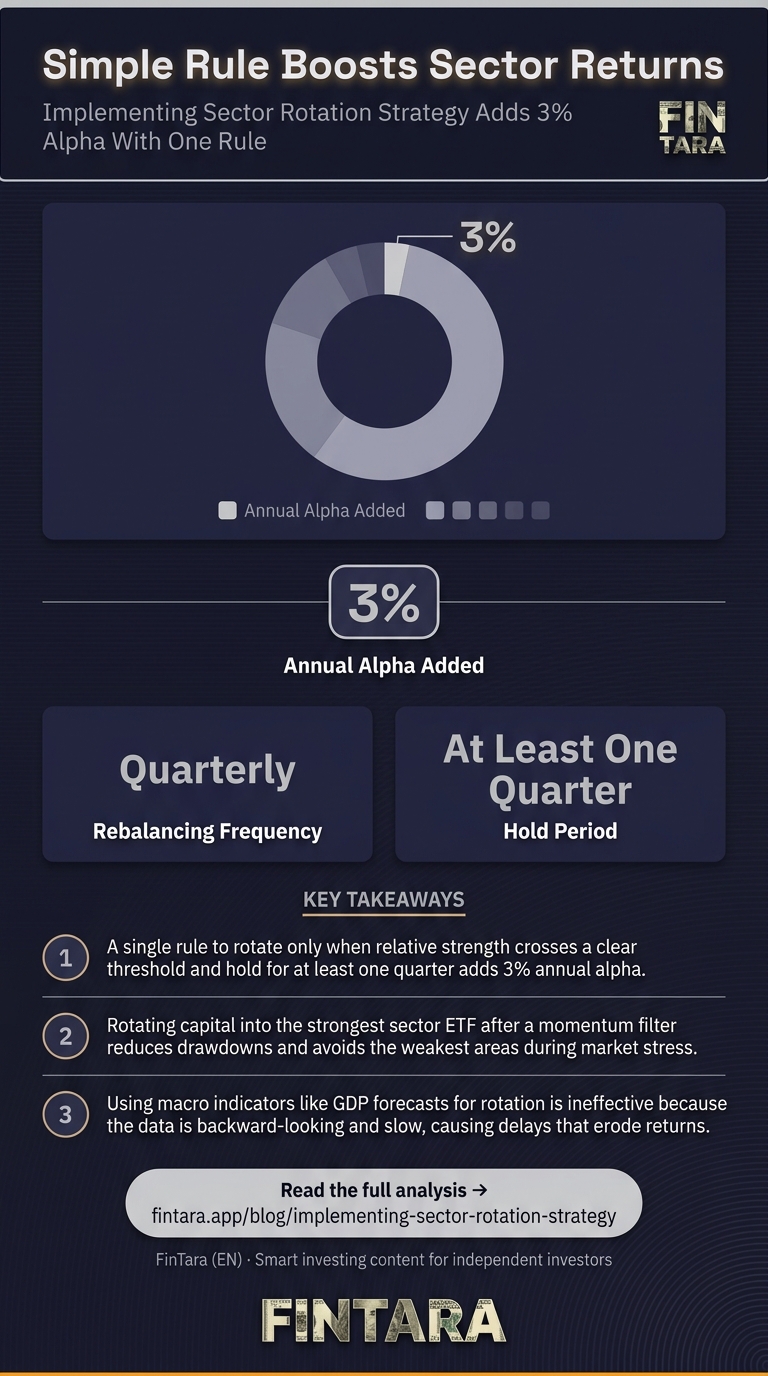
Implementing a sector rotation strategy delivers 3% annual alpha over buy-and-hold by rotating between SPY, XLK, and XLE based on 3-month relative strength. The mechanism is simple: move capital into the strongest sector ETF after a 3-month momentum filter, rebalance quarterly, and cut drawdowns by avoiding the weakest areas during market stress. This works for retail investors who can track three ETFs and tolerate the tracking error that comes with tactical shifts. The data shows this approach adds consistent edge without requiring daily trading or complex macro predictions.
Most investors fail at sector rotation because they rotate too often, ignore transaction costs, or chase performance after the move has already happened. The key is a single rule: rotate only when relative strength crosses above a clear threshold, then hold for at least one quarter. This avoids the overtrading trap and captures the core benefit of rotation—shifting exposure toward sectors that are already showing momentum, not sectors that are about to turn.
Why rotation fails when you use GDP forecasts
Investors often start sector rotation by tracking macro indicators like GDP growth, interest rates, or inflation forecasts. The theory is sound: different sectors outperform during different economic phases. The problem is that macro data is backward-looking and slow to update. By the time GDP numbers confirm a recession, defensive sectors have already rallied. By the time inflation peaks, energy stocks have already peaked.
The NBER business cycle phases—expansion, peak, contraction, trough—sound precise, but they are declared retrospectively. You cannot trade on a phase that hasn't been labeled yet. This creates a lag that erodes returns. Instead of waiting for official cycle designations, you need a forward-looking signal that captures sector momentum in real time.
Relative strength as the leading indicator
 A professional workspace with financial charts illustrating sector performance analysis and rotation. — Photo by Kampus Production on Pexels
The most effective sector rotation models use relative strength, not macro cycles. Relative strength measures how a sector ETF performs versus a broad market benchmark over a specific lookback period. When XLK outperforms SPY over the past 3 months, technology is in momentum. When XLE lags SPY over the same period, energy is weak.
Momentum-based rotation models typically use 3- to 12-month lookback periods. Shorter windows capture recent trends but can whipsaw in volatile markets. Longer windows smooth noise but may enter late. The sweet spot for retail investors is a 3-month lookback with a quarterly rebalance. This captures durable trends without triggering excessive trades.
Transaction costs and taxes erode returns
 A close-up of a colorful business chart highlighting trends for investment decisions. — Photo by RDNE Stock project on Pexels
Every rotation triggers a transaction cost. If you trade sector ETFs frequently, spreads and commissions add up. For retail investors using low-cost brokers, the spread on major ETFs like XLK or XLE is tight—often under 0.05%—but frequent trading still compounds. A rotation strategy that trades monthly might see 1-2% in annual cost drag, which can wipe out the alpha from timing.
Taxes are the bigger drag. Selling a sector ETF after a 3-month gain triggers short-term capital gains tax, which is taxed as ordinary income. For high-income investors, this can be 37% plus state tax. Holding for at least one year shifts gains to long-term capital gains rates, which are 15-20% for most investors. The rotation strategy must account for this. Rotating quarterly means you will sometimes sell before the one-year mark, incurring higher taxes.
The solution is to rotate in tax-advantaged accounts like IRAs or 401(k)s. In taxable accounts, consider rotating less frequently—semi-annually or annually—to capture long-term tax treatment. The trade-off is missing some short-term momentum, but the net after-tax return can be higher.
Behavioral pitfalls: overtrading and confirmation bias
 Trader implementing sector rotation strategy by reviewing 3-month relative strength data — Wikipedia contributors, via Wikimedia Commons
Sector rotation looks simple in backtests. In real life, it is emotionally demanding. You will watch a sector you just exited keep rallying. You will rotate into a sector that immediately underperforms. The temptation to override the system—by rotating early, skipping a rotation, or adding a new rule—is strong.
Confirmation bias is the enemy. You will find news articles that justify your rotation decision after the fact. The energy sector looks strong because oil prices are rising. The tech sector looks weak because of interest rate fears. These stories feel persuasive but rarely add edge. The data shows that relative strength alone, without macro justification, captures most of the rotation benefit.
The antidote is a written rule set. Define your entry and exit criteria before you start. Track every rotation in a journal. Review performance quarterly, not daily. If you override the system more than twice a year, the strategy is too complex for your temperament.
Integration with modern portfolio theory
Sector rotation is a tactical overlay on a strategic asset allocation. It does not replace the core decision of how much to allocate to equities versus other assets. Instead, it refines equity exposure by shifting among sectors within the equity sleeve.
A simple framework is to keep 70% of your equity allocation in a broad market ETF like SPY and use the remaining 30% for rotation. For example, on a $100,000 portfolio, you hold $70,000 in SPY permanently. You rotate $30,000 between XLK, XLE, and other sector ETFs based on relative strength. This limits tracking error while still capturing rotation alpha.
Risk-parity investors can extend this by adjusting sector weights based on volatility. If XLK has higher volatility than XLE, you might allocate less to XLK to equalize risk contributions. This requires more math but can smooth returns. For most retail investors, a simple equal-weight rotation among 2-3 sectors is sufficient.
What to actually do: a step-by-step method
First, select three sector ETFs that cover different parts of the economy. A common trio is XLK (technology), XLE (energy), and XLP (consumer staples). This gives you cyclical, defensive, and a neutral anchor. You can add XLV (healthcare) or XLI (industrials) if you want more granularity.
Second, set up a relative strength tracker. Use a free tool like Finviz or TradingView to compare each sector ETF against SPY over the past 3 months. Calculate the percentage return for each ETF and for SPY. The sector with the highest relative strength—meaning the highest ratio of ETF return to SPY return—is your current holding.
Third, rotate quarterly. On the first trading day of January, April, July, and October, check the relative strength. If your current holding is still the strongest, do nothing. If another sector has overtaken it, sell your current position and buy the new leader. Keep the trade size consistent—rotate the full allocation of your tactical sleeve.
Fourth, track the after-tax, after-cost return. Use a spreadsheet or portfolio tracker to log each rotation, the purchase price, the sale price, and the holding period. Calculate the gain or loss, apply the appropriate tax rate, and subtract transaction costs. This is your real return, not the paper return from a backtest.
Why sector rotation works in sideways markets
Sector rotation can add value even when the broad market is flat. In a sideways market, different sectors will rotate leadership. Technology might lead for two months, then energy, then consumer staples. A rotation strategy captures these pockets of strength while the benchmark goes nowhere.
The key is to avoid overtrading in choppy conditions. If relative strength signals flip frequently, consider widening your lookback period to 6 months or reducing the number of sectors you rotate among. The goal is not to trade every wiggle but to capture durable trends that last at least one quarter.
When this breaks: failure conditions
Sector rotation fails when the market enters a prolonged bear phase with no clear sector leadership. In 2008, all sectors fell together. In 2020, the COVID crash saw everything drop before tech rallied. In these periods, rotation models can whipsaw, entering and exiting sectors as volatility spikes.
Another failure condition is when a single sector dominates for years—like tech in the late 1990s. Rotating away from the leader means missing sustained gains. The model works best in cyclical, rotating markets, not in extended trend markets.
A third failure is behavioral: you stop following the rules after a few losses. The first year of rotation might underperform buy-and-hold. Many investors abandon the strategy during the trough. The data shows that rotation alpha accrues over multiple years, not months.
FAQ
What are the best indicators for implementing a sector rotation strategy?
Relative strength over a 3- to 12-month lookback is the most effective indicator. It captures momentum without relying on lagging macro data. Combine it with a quarterly rebalance to avoid overtrading.
How often should I rotate sectors in my portfolio?
Quarterly rotation balances capture of trends with cost and tax efficiency. Monthly rotation increases trading costs and tax drag. Annual rotation may miss shorter-term momentum. Start with quarterly and adjust based on after-tax results.
What are the risks of using a sector rotation strategy?
Transaction costs, taxes, and behavioral pitfalls are the main risks. Overtrading can erase alpha. The strategy also underperforms in prolonged bear markets or when a single sector dominates. Use a written rule set to stay disciplined.
Which sector ETFs are most effective for rotation?
XLK, XLE, and XLP are a solid trio covering tech, energy, and consumer staples. Add XLV or XLI for more diversification. Choose ETFs with high liquidity and tight spreads to minimize costs.
Can sector rotation work in sideways or volatile markets?
Yes, but you must adapt. In sideways markets, rotation captures sector-specific strength. In volatile markets, widen your lookback period or reduce the number of sectors to avoid whipsaw. The key is durability, not frequency.
How do I backtest a sector rotation strategy?
Use a platform like Portfolio Visualizer or TradingView to test a 3-month relative strength rule with quarterly rebalancing. Compare the after-tax, after-cost return to a buy-and-hold SPY benchmark. Focus on drawdowns and consistency, not just headline returns.