
Vanguard S&P 500 ETF (VOO) charges 0.03% annually while SPDR S&P 500 ETF (SPY) costs 0.0945%. That 0.0645% difference looks trivial until you run the math over 30 years. A 1% expense ratio advantage delivers roughly 10% more terminal value due to compounding mechanics. The gap between VOO and SPY isn't 1% — it's 0.0645% — but the principle holds: expense ratios are silent wealth taxes that accelerate with time. This analysis gives you the exact framework to choose ETFs based on total cost, not just the headline expense ratio, and shows when low fees actually matter versus when they're marketing theater.
Why expense ratios alone mislead investors
Expense ratios measure the annual fee fund managers charge as a percentage of assets. VOO's 0.03% means you pay $3 annually per $10,000 invested. SPY's 0.0945% costs $9.45 per $10,000. The raw difference is $6.45 per year per $10,000. Over 30 years at 7% annual returns, that $6.45 compounds into a real drag on terminal value. The math is brutal: small percentages multiplied by large balances over long periods destroy wealth silently.
The trap is treating expense ratios in isolation. You must compare them across identical exposures. VOO and SPY both track the S&P 500 — their expense ratios should be directly comparable. But when comparing VOO to ITOT (iShares Core S&P Total U.S. Stock Market ETF), you're comparing different exposures. ITOT holds 3,700+ stocks versus VOO's 500. The expense ratio match at 0.03% is coincidental; the holdings are fundamentally different.
Most investors fixate on the cheapest option without asking: cheapest for what exposure? A 0.01% fee on a poorly constructed index is worse than a 0.03% fee on a broad, liquid benchmark. The expense ratio is a cost metric, not a performance predictor.
The compounding math: 0.03% vs 0.0945% over 30 years
 An overhead view of financial reports and graphs on a wooden desk, representing the detailed analysis required to compare ETF fees. — Photo by Lukas Blazek on Pexels
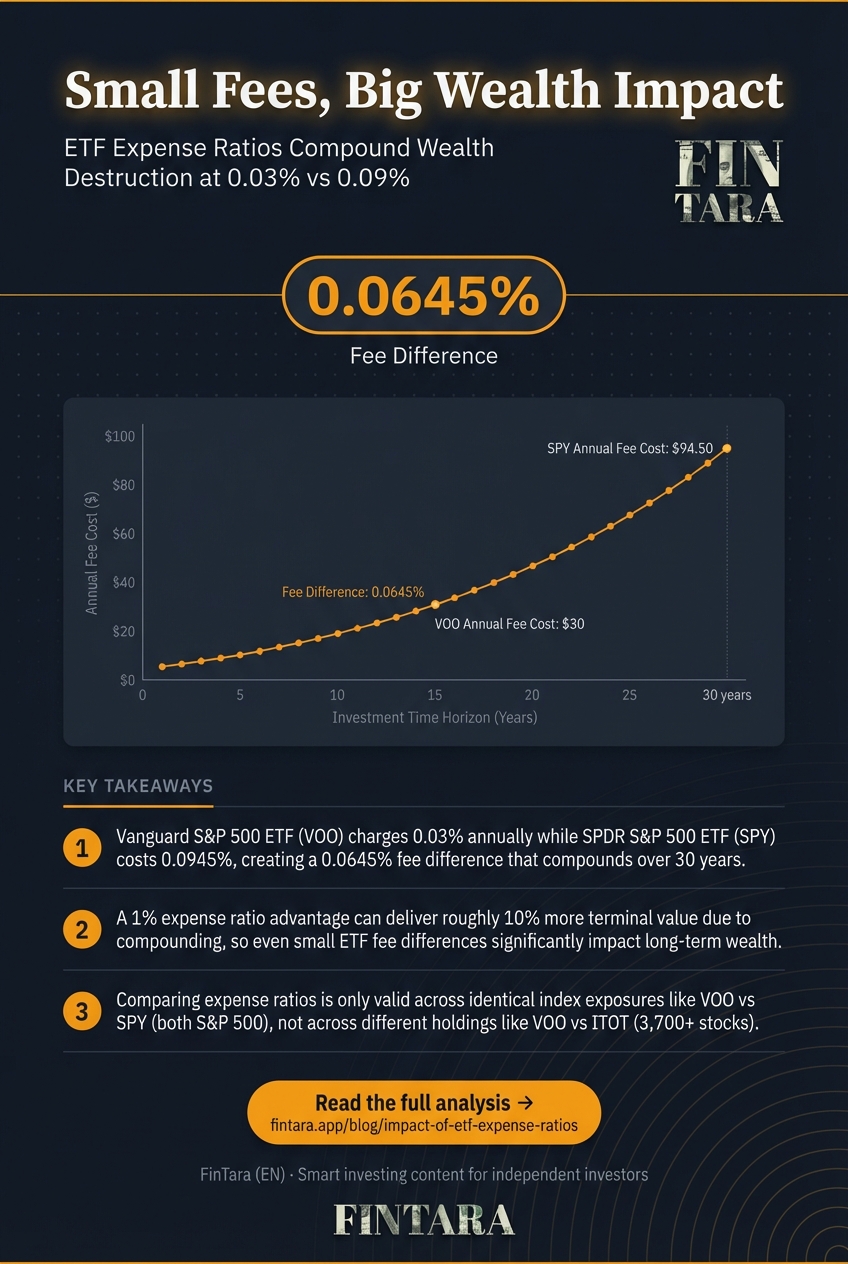
Assume a $100,000 initial investment with 7% annual returns, no additional contributions. At 0.03% expense ratio (VOO), the fund subtracts $30 in year one. At 0.0945% (SPY), it subtracts $94.50. The gap is $64.50 in year one. Over 30 years, this difference compounds because the lower-fee fund retains more capital to grow.
The terminal value at 0.03% expense ratio: approximately $761,000. At 0.0945%: approximately $743,000. The gap is $18,000 on a $100,000 starting point. That's 1.8% less wealth after three decades from a 0.0645% fee difference. The 1% rule of thumb — that 1% lower fees yield roughly 10% more terminal value — is directionally correct. The VOO vs SPY gap is smaller, but the mechanism is identical: expense ratios compound against you.
The key insight: expense ratios matter most in passive index funds where fees are the primary variable you control. In active funds, manager skill (or lack thereof) dwarfs fee differences. But for index exposure, fee minimization is the only edge you get.
How hidden costs dwarf expense ratios for retail investors
 A top-down perspective of documents and a calculator on a desk, symbolizing the mathematical calculation of long-term cost differences between funds. — Photo by Tima Miroshnichenko on Pexels
Expense ratios are visible. Trading costs are not. Every time you buy or sell an ETF, you pay a bid-ask spread and potentially a brokerage commission. For a retail investor trading SPY with a $5 commission and a $0.01 spread on a $500 share price, the round-trip cost is $5 + ($0.01 × 500 × 2) = $15. On a $10,000 position, that's 0.15% one-way. Do that quarterly and you've added 0.6% annual drag — double the expense ratio gap between VOO and SPY.
Bid-ask spreads vary by ETF liquidity. SPY trades 80+ million shares daily; its spread is typically $0.01. A niche emerging markets ETF might trade 500,000 shares daily with a $0.05 spread. On a $50 share price, that's 0.1% one-way. For a $5,000 position, you're paying $5 in spread alone, plus commissions. The expense ratio is irrelevant if your trading costs eat your returns.
Advisor fees layer another cost. A 1% annual advisor fee on top of a 0.09% ETF expense ratio means you're paying 1.09% total. That 1% advisor fee dwarfs the 0.0645% ETF gap. The math: 1% fee over 30 years on a $100,000 portfolio at 7% returns reduces terminal value by roughly $85,000. The SPY vs VOO gap is $18,000. Your advisor costs you 4.7x more than choosing the cheaper S&P 500 ETF.
Fidelity ZERO fund: 0.00% expense ratio with a catch
 Cover: Analyst comparing VOO and SPY expense ratios on desk charts — Photo by Nataliya Vaitkevich on Pexels
Fidelity ZERO Total Market Index Fund (FZROX) has a 0.00% expense ratio. It's a mutual fund, not an ETF, but the cost appeal is obvious. Zero fees on a total market fund sounds unbeatable. The catch: FZROX is proprietary to Fidelity. You can't hold it outside Fidelity accounts. If you leave Fidelity, you must sell — triggering potential tax events. The fund also tracks a Fidelity-developed index, not a standard benchmark like the CRSP US Total Market Index. Tracking error may differ from broad-market ETFs.
For buy-and-hold investors who stay at Fidelity, FZROX is mathematically optimal. For investors who value portability or benchmark precision, a 0.03% ETF like ITOT offers flexibility worth the tiny fee. The 0.00% expense ratio is a marketing win for Fidelity, but it locks you into their ecosystem. Cost isn't just the fee — it's the constraint.
When low expense ratios don't matter: active management and niche exposures
If you're buying an actively managed ETF, expense ratios are secondary to manager skill. ARK Innovation ETF (ARKK) charges 0.75%. That's 25x VOO's fee. If the manager delivers alpha, the fee is justified. If not, you're paying for underperformance. The expense ratio debate is irrelevant here — the decision is whether you believe in the manager's process.
Similarly, niche exposures like uranium ETFs or micro-cap strategies have higher expense ratios due to lower AUM and complexity. The Sprott Uranium Miners ETF (URNM) charges 0.75%. You're paying for specialized exposure that's hard to replicate. The fee is a trade-off for access. Low expense ratios matter most for broad, liquid, passive exposures where you have multiple cheap alternatives. For specialized strategies, the fee is the price of admission.
The inversion: don't chase the lowest expense ratio if the fund doesn't match your thesis. A 0.01% fee on a fund that doesn't deliver the exposure you want is wasted money. Fees matter, but only relative to the fund's purpose.
What to actually do: total cost analysis framework
Step 1: Identify your exposure need. S&P 500? Total US market? International? Factor-based? Your expense ratio comparison starts here.
Step 2: Compare identical exposures. For S&P 500, VOO (0.03%) vs SPY (0.0945%) is a direct comparison. For total US market, VTI (0.03%) vs ITOT (0.03%) vs FZROX (0.00%) requires noting the mutual fund constraint.
Step 3: Layer in trading costs. Use your broker's commission schedule and check ETF liquidity. For large positions, bid-ask spreads matter more than expense ratios.
Step 4: Add advisor fees if applicable. If you pay 1% to an advisor, the ETF expense ratio is a rounding error. Consider low-cost ETFs within a low-cost advisor platform or self-manage with a fee-only planner.
Step 5: Use a tool to model total cost. Portfolio Visualizer's expense ratio calculator lets you input multiple ETFs and see 30-year drag. Run scenarios: VOO vs SPY vs ITOT. The tool shows terminal value differences from fee structures alone.
Step 6: Execute. For new money, choose the lowest-cost ETF with the right exposure and liquidity. For existing positions, don't churn to save 0.06% — trading costs will eat the benefit. Hold until rebalancing triggers.
FAQ
How do ETF expense ratios affect my long-term returns?
Expense ratios compound against you annually. A 0.03% fee on a $100,000 portfolio costs $30 in year one. Over 30 years at 7% returns, a 1% fee difference reduces terminal value by roughly 10%. Lower expense ratios mean more capital stays invested, accelerating compounding.
What is a good expense ratio for an ETF?
For broad index ETFs like S&P 500 or total market, anything under 0.10% is competitive. VOO and ITOT at 0.03% are excellent. For niche or active ETFs, 0.50% to 0.75% may be reasonable if the exposure is unique. Compare to peers with identical holdings.
How do expense ratios differ between index ETFs and actively managed ETFs?
Index ETFs typically charge 0.03% to 0.20%. Active ETFs range from 0.50% to over 1%. The higher fee pays for manager research and trading flexibility. You're betting the manager can outperform enough to cover the fee. Most active ETFs underperform their benchmarks after fees.
Can low expense ratios make up for poor fund performance?
No. A low-fee fund that tracks a poor index or has high tracking error will underperform. Expense ratios matter most when comparing identical exposures. Choose the right exposure first, then minimize fees within that category.
How do I compare expense ratios across different ETF providers?
Use tools like ETF.com or Morningstar to filter by exposure and sort by expense ratio. Check liquidity (average daily volume) and bid-ask spreads. For S&P 500 exposure, VOO vs SPY is a direct comparison. For total market, compare VTI, ITOT, and FZROX noting mutual fund constraints.
Are there hidden costs besides expense ratios in ETFs?
Yes. Bid-ask spreads, brokerage commissions, and advisor fees can exceed the expense ratio. A 0.01% spread on a low-liquidity ETF costs more than a 0.03% expense ratio if you trade frequently. Check your broker's fee schedule and the ETF's average spread before buying.