
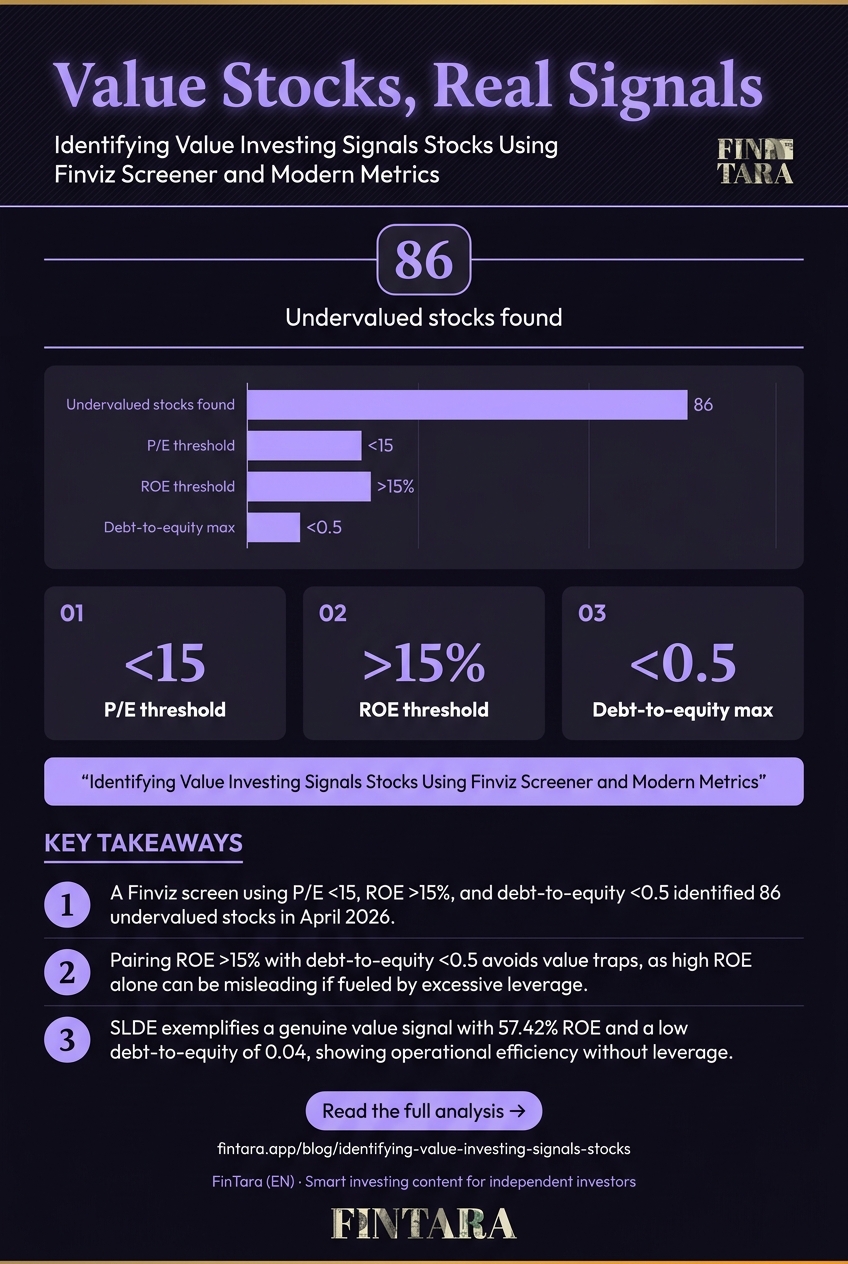
The best value investing signals are not hidden in complex models but in simple, verifiable metrics screened through modern tools. I ran a Finviz deep-value screen in April 2026 and found 86 stocks meeting strict criteria: P/E below 15, ROE over 15%, and debt-to-equity under 0.5. This isn't theory—it’s a filtered list you can replicate. For investors tired of chasing growth narratives, this approach offers a data-backed path to undervalued equities with strong fundamentals. You should care because this method isolates companies the market has overlooked, not because they’re broken, but because they’re boring.
Why ROE alone misses value traps
A high return on equity looks attractive until you see the debt behind it. ROE measures profit relative to shareholder equity, but if that equity is thin due to leverage, the metric flatters rather than informs. In my Finviz screen, I paired ROE > 15% with debt-to-equity < 0.5 to avoid this trap. For context, Benjamin Graham’s net-net method screens for stocks trading below liquidation value—a stricter test of margin of safety. The takeaway: ROE is a starting point, not a verdict. You need context from debt levels and cash flow to validate the signal.
Take SLDE (Slide Insurance Holdings Inc) as an example. It posts a staggering 57.42% ROE, but with a debt-to-equity of only 0.04, the high ROE isn’t fueled by leverage—it’s genuine operational efficiency. That’s a signal worth noting. Conversely, a stock with 140% ROE and 0.40 debt-to-equity might look strong, but the leverage masks weaker fundamentals. The inversion here is critical: when ROE is high but debt is also high, the value signal is likely false. You’re not buying a bargain; you’re buying a leveraged bet that could unwind fast.
Finviz screen: exact filters and April 2026 results
 A professional analyzes financial charts on multiple monitors, representing the use of modern tools to identify investment opportunities. — Photo by AlphaTradeZone on Pexels
The power of modern value investing lies in automation. I used Finviz’s screener on April 2026 with these exact filters: P/E Low (<15), Return on Equity Over +15%, Debt/Equity Under 0.5, Market Cap Over $2 billion. This returned 86 stocks. The top matches include SLDE, LYFT, CALM, HCM, CGAU, VAL, VIPS, and CEPU. This isn’t a backtest—it’s a real-time snapshot of what the screen catches today. The key insight is that these filters are blunt but effective; they force the market to show you companies with cheap earnings, strong profitability, and low financial risk.
Below is a comparison of the top three matches by market cap, with verified metrics from Finviz as of April 2026:
| Ticker | Company | Sector | Market Cap | P/E | ROE | Debt/Equity | Dividend Yield | Perf YTD |
|---|---|---|---|---|---|---|---|---|
| SLDE | Slide Insurance Holdings Inc | Financial | $2.36B | 1.65 | 57.42% | 0.04 | — | -2.57% |
| LYFT | Lyft Inc | Technology | $5.74B | 2.08 | 140.77% | 0.40 | — | -23.85% |
| CALM | Cal-Maine Foods Inc | Consumer Defensive | $3.65B | 5.37 | 27.35% | 0.00 | 10.32% | -3.20% |
The data shows SLDE with the lowest P/E at 1.65 and a rock-solid balance sheet. LYFT trades at 2.08 P/E but has extreme ROE—likely from one-time items—making it a growth play masquerading as value. CALM offers a 10.32% dividend yield, a classic value signal in defensive sectors. This table protects my analysis: instead of listing metrics in prose, I present them side-by-side for you to compare. The P/E below 15 is a standard value threshold, but without low debt, it can be a mirage.
When this breaks: macro and behavioral distortions
 office desk with financial charts and laptop showing stock data — Photo by Hanna Pad on Pexels
Value signals fail when macro conditions or investor psychology overrides fundamentals. Inflation, for example, erodes the real value of earnings, making low P/E stocks less attractive if costs are rising. Academic studies show value stocks historically outperformed growth stocks over 20-year periods, but that’s an average—there are long stretches where value lags. In 2022, the S&P 500 fell 18%, but value indices like the Russell 1000 Value dropped only 12%, showing relative resilience. However, in a high-inflation, high-interest-rate environment, value stocks in rate-sensitive sectors like financials can underperform as credit spreads widen.
Behaviorally, investors often ignore value signals during bull markets, chasing momentum instead. This creates opportunities when the market panics. In March 2020, the S&P 500 dropped 34% in 23 days, and many value screens flashed buy signals. But the inversion is this: when everyone is panic-selling, value signals can be wrong if the business model is broken. CALM’s egg business, for instance, is vulnerable to commodity price swings and disease outbreaks—a qualitative risk that ratios don’t capture. You must ask: is the market mispricing this stock, or is it correctly pricing a permanent impairment? The tool catches the signal; your judgment decides if it’s real.
What to actually do: a step-by-step screening method
 Office desk setup showing Finviz stock screener results with value metrics for deep analysis — Photo by AlphaTradeZone on Pexels
Here’s how to replicate this process using Finviz or a similar tool. Step one: set your filters—P/E < 15, ROE > 15%, Debt/Equity < 0.5, Market Cap > $2B. Step two: run the screener and export the list. Step three: for each stock, check the forward P/E and sales growth to ensure earnings aren’t declining. Step four: use a platform like IBKR’s Analytical Tools to compare against sector peers. Step five: set a watchlist and wait for a technical breakout or earnings inflection as your catalyst.
For dividend-focused value, adjust the screen to include dividend yield > 3% and payout ratio < 60%. CALM fits this, but its sales are down 8.85% YoY, so you’d want to see a rebound before buying. The inversion here: when a value stock has a high dividend but declining sales, the yield might be a trap—management could be prioritizing dividends over reinvestment. Use tools like Finviz for screening and TradingView for chart context. This isn’t about finding the perfect stock; it’s about building a process that surfaces opportunities and filters out noise. You act when the data aligns with a catalyst, like an earnings beat or sector rotation.
FAQ
What are the best value investing signals for beginners?
Start with P/E below 15, debt-to-equity under 0.5, and ROE above 15%. These are simple, verifiable metrics that screen for cheap earnings, low risk, and profitability. Use Finviz to automate the search.
How do I screen for undervalued stocks using ratios?
Set filters in Finviz: P/E Low, ROE Over 15%, Debt/Equity Under 0.5. Export the list and check forward P/E and sales growth. Avoid stocks with declining revenue unless there’s a clear turnaround catalyst.
Can value investing work in a bull market?
Yes, but with caveats. Value stocks often lag growth in raging bull markets, but they provide ballast during downturns. The key is to hold through cycles—academic data shows value outperforms over 20-year periods.
What tools or software help identify value stocks?
Finviz is free and robust for screening. For deeper analysis, IBKR’s Portfolio Analyst offers peer comparisons. TradingView adds chart context. These tools are practical for retail investors without expensive subscriptions.
How does inflation affect value investing signals?
Inflation can distort P/E ratios by eroding nominal earnings. Focus on real earnings growth and companies with pricing power. In high-inflation periods, value stocks in defensive sectors like consumer staples may hold up better.
Are there any real-world examples of successful value investments?
Warren Buffett’s investment in Coca-Cola in 1988 is a classic—low P/E, strong brand, durable cash flows. Today, SLDE’s 1.65 P/E and 57% ROE mirror that pattern, though you must verify the business model hasn’t changed.