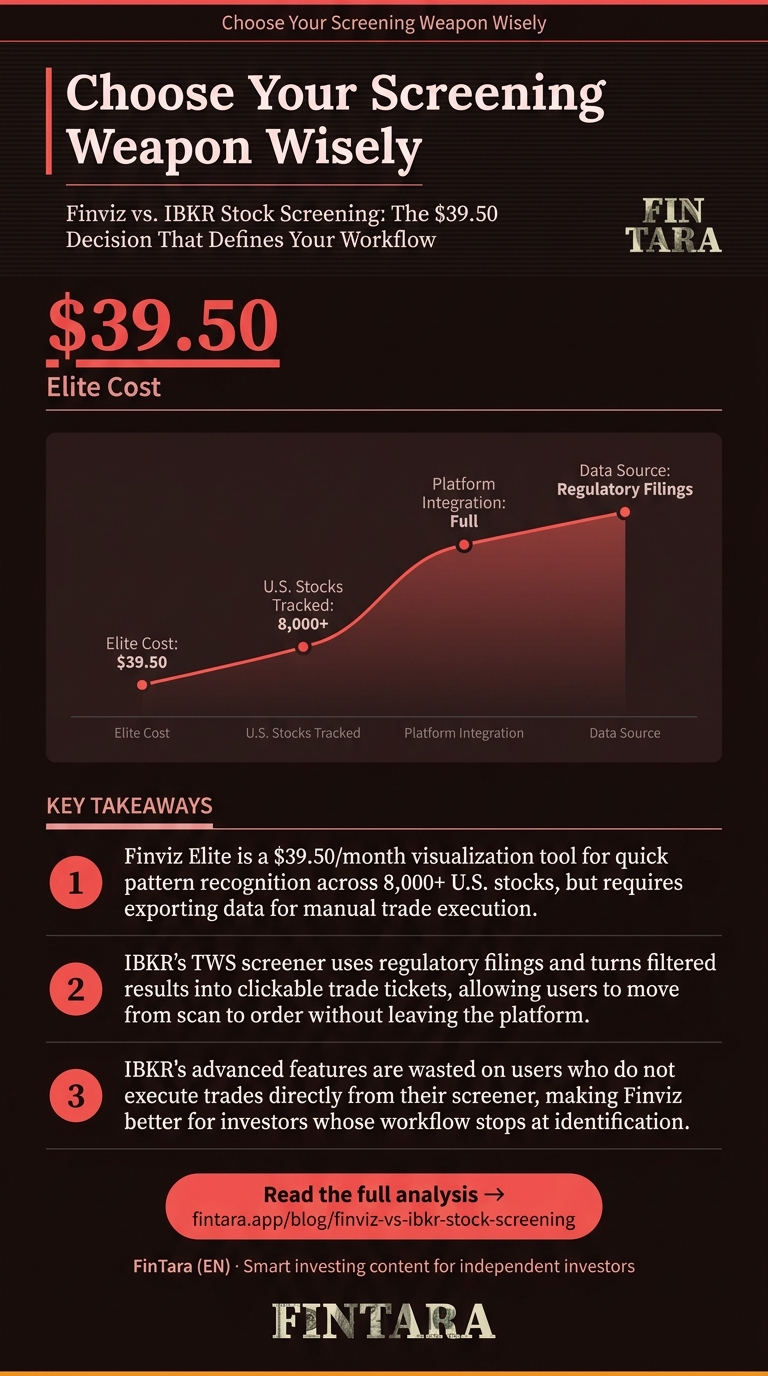
Finviz Elite costs $39.50 per month while IBKR's screener comes free with any account. That price gap reflects a deeper split: Finviz is a visualization engine built for quick pattern recognition, while IBKR’s Trader Workstation (TWS) is an institutional-grade terminal where screening feeds directly into execution. For a retail investor, the choice isn’t about features—it’s about whether you want a scouting tool or an integrated cockpit. If your process stops at identification, Finviz wins. If it flows from scan to trade without leaving the platform, IBKR is the only logical choice.
Why Finviz and IBKR Serve Different Jobs
Most comparisons pit these tools head-to-head as if they’re interchangeable. They’re not. Finviz is a web-based screener optimized for visual heat maps and rapid filtering across 8,000+ U.S. stocks. IBKR’s TWS screener is a deep fundamental analysis engine tied to live account data, regulatory filings, and direct order routing. You don’t use them for the same task.
Finviz excels at answering: “What’s moving right now?” Its heat map shows sector momentum in real time, and the “Descriptive,” “Technical,” and “Fundamental” filter categories let you switch lenses in seconds. The Elite tier removes the 15-minute delay and adds real-time quotes, backtesting, and custom formulas. But it’s a standalone tool—you export data to Excel or your broker manually.
IBKR’s screener answers: “What’s worth buying, and can I execute now?” The TWS platform pulls fundamental data directly from 10-K and 10-Q filings, and every filtered result is a clickable trade ticket. You screen for low P/E, check the Option Strategy Builder for hedging, and place the order without switching tabs. The cost is complexity: TWS has a steeper learning curve and is overkill if you just want a quick scan.
The inversion here is critical: If you’re not executing directly from your screener, IBKR’s depth is wasted. Finviz’s simplicity becomes a feature, not a limitation.
The Evidence: A Live Deep-Value Screen Compared
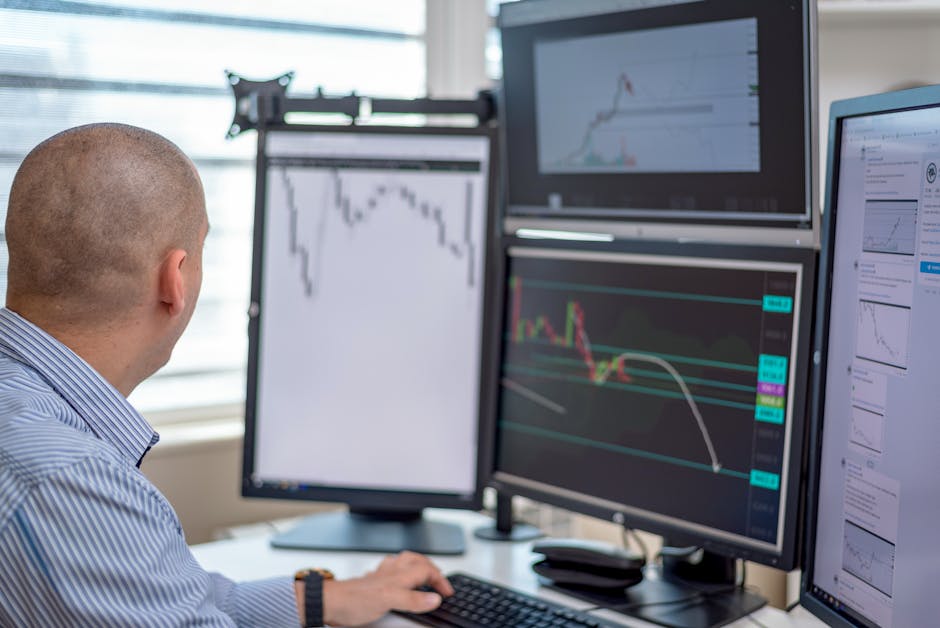
 Professional reviewing financial screening results and analytical charts on a laptop in a modern office. — Photo by AlphaTradeZone on Pexels
Let’s run the same deep-value screen on both platforms and see the practical difference. We’ll filter for P/E < 15, ROE > 15%, Debt/Equity < 0.5, and Market Cap > $2B. This is a classic value screen that should surface quality names at reasonable prices.
On Finviz as of April 2026, this screen returns 89 stocks. The top matches include Slide Insurance (SLDE), Lyft (LYFT), Cal-Maine Foods (CALM), and HUTCHMED (HCM). Each has distinct profiles:
| Ticker | P/E | ROE | Debt/Equity | Market Cap | Q Perf | YTD Perf |
|---|---|---|---|---|---|---|
| SLDE | 1.60 | 57.42% | 0.04 | $2.30B | +16.53% | -5.18% |
| LYFT | 2.01 | 140.77% | 0.40 | $5.54B | -20.45% | -26.48% |
| CALM | 5.31 | 27.35% | 0.00 | $3.61B | -5.29% | -4.18% |
| HCM | 5.34 | 45.85% | 0.08 | $2.44B | -8.56% | +5.03% |
The data shows immediate tension. SLDE trades at a P/E of 1.60 with ROE above 57%, yet it’s down 5% YTD. LYFT’s ROE is 140%, but the stock is down 26% YTD. CALM offers a 10.43% dividend yield but revenue fell 8.85% YoY. HCM is the only name with positive YTD performance, yet sales dropped 12.78% YoY.
Finviz surfaces these contradictions visually. You see the heat map, click a ticker, and get the full dashboard. But you can’t ask: “What’s the implied volatility on LYFT?” or “Can I hedge CALM with options?” You’d need to leave Finviz and open IBKR or another platform.
IBKR’s TWS screener, when run with identical filters, returns a similar list but adds layers. You can overlay institutional ownership changes, insider transactions, and real-time options chains. For SLDE, you’d see that analyst recommendations average 1.17 (strong buy), and you could immediately build a covered call strategy in the Option Strategy Builder to generate income while waiting for a re-rating. The screen doesn’t just identify—it integrates with your next move.
The key number here is the 89 stocks Finviz returns. IBKR won’t return a different number, but the actionable intelligence per stock is higher because the data is live and embedded in your trading workflow. Finviz is a map; IBKR is the GPS with live traffic.
When This Breaks: Failure Conditions for Each Tool
 Businessperson examining data analytics and stock market graphs on a laptop screen at a workspace. — Photo by AlphaTradeZone on Pexels
Every tool fails under specific conditions. Finviz breaks when you need real-time execution or deep fundamental verification. The Elite subscription costs $39.50/month and delivers real-time prices, but it’s still a delayed feed compared to IBKR’s direct market data. If you’re day trading momentum gaps, that 15-minute delay on the free tier is a dealbreaker. Even Elite isn’t millisecond-fast.
Finviz also struggles with large-scale backtesting. You can’t easily test a screen across multiple market cycles within the platform. The “Backtest” feature in Elite is limited to predefined strategies; you can’t code your own. If your thesis requires testing a custom screen across the 2008 or 2020 crashes, you’ll export to Excel or Python—adding steps and potential errors.
IBKR’s TWS breaks under complexity overload. The screener is powerful but buried in menus. A new user might spend hours finding the right filters, and the learning curve can discourage use altogether. More critically, IBKR’s fundamental data is sourced from regulatory filings, which are accurate but not always timely. A 10-K filed last month might not reflect last week’s operational changes. If you’re trading on near-term catalysts, IBKR’s data can lag fast-moving news.
The inversion: If you’re a passive investor who screens monthly, Finviz’s simplicity beats IBKR’s depth. The time saved not navigating TWS outweighs the marginal data advantage. But if you’re actively managing a portfolio with weekly rebalances, IBKR’s integration is non-negotiable.
What to Actually Do: Match the Tool to Your Process
 Split-screen visualization showing Finviz's pattern recognition interface versus IBKR's data-heavy terminal — Wikipedia contributors, via Wikimedia Commons
Choose Finviz if your workflow is: Scan → Identify → Research elsewhere → Execute. The $39.50/month Elite subscription is justified if you use heat maps daily for market overview and need real-time quotes without opening a broker. Export data to Excel for further analysis, then place trades in your brokerage account. This works for swing traders and long-term investors who value visual clarity over integration.
Use IBKR’s TWS screener if your workflow is: Scan → Analyze → Hedge → Execute—all within one platform. The screener is free with an account, and the data depth is unmatched for fundamental analysis. Start with the “Fundamental” filter set, add technical overlays, then use the Option Strategy Builder to stress-test your position. This is ideal for options traders, active portfolio managers, and anyone who wants to move from idea to trade in minutes.
For mobile functionality, Finviz’s website is responsive but not optimized for screening on small screens. IBKR’s mobile app includes a simplified screener, but it’s clunky for deep analysis. If you screen on the go, neither is perfect—but Finviz’s visual layout adapts better to quick checks.
The actionable method: Run the same deep-value screen on both tools for one week. Note which names you’d actually trade and why. If Finviz’s heat map sparks ideas but you execute in IBKR, that’s your hybrid workflow. If you complete the entire trade in TWS without leaving, IBKR is your primary. The tool that fits your process—not the one with more features—wins.
FAQ
Is Finviz free?
Yes, Finviz offers a free tier with delayed data and limited filters. The Elite subscription costs $39.50 per month and adds real-time quotes, backtesting, and custom formulas. The free version works for casual screening; active traders need Elite.
Does Interactive Brokers have a stock screener?
Yes, IBKR’s Trader Workstation (TWS) includes a comprehensive stock screener. It’s free for clients and integrates fundamental data from regulatory filings with real-time execution. The tool is institutional-grade but has a learning curve.
Which is better for day trading: Finviz or IBKR?
IBKR is better for day trading because its screener connects directly to order routing and real-time data. Finviz’s Elite tier offers real-time prices but no direct execution. Day traders need the integrated workflow IBKR provides.
Can I export data from Finviz to Excel?
Yes, Finviz Elite allows data export to CSV or Excel. The free tier does not. Exported data includes all filtered columns, making it easy to run custom analysis in spreadsheets or connect to other tools.
Does IBKR screener include real-time data?
Yes, IBKR’s TWS screener uses live market data for clients. The fundamental data is sourced from regulatory filings, which may lag breaking news, but price and volume data are real-time. This is critical for intraday decisions.
How much does Finviz Elite cost?
Finviz Elite costs $39.50 per month when billed monthly. Annual billing options may offer a discount, but the standard rate is $39.50 per month. This includes real-time data, backtesting, and custom formulas.
Can I use both Finviz and IBKR together?
Yes, many investors use Finviz for initial screening and visualization, then move to IBKR for deep analysis and execution. This hybrid approach leverages Finviz’s speed and IBKR’s integration. The key is defining which tool does what in your workflow.