
Concentrated portfolios promise higher returns through conviction, but the data shows they generate huge drawdowns and massive wealth destruction instead. The core problem is overconfidence: investors believe they can pick winners, yet evidence reveals little alpha from concentration after accounting for risk. The fix is a disciplined sizing framework using volatility targets and Kelly-inspired limits, applied to every position before entry. This article provides the exact calculations and psychological checks to prevent fatal errors in your portfolio construction.
The Evidence Against Concentration
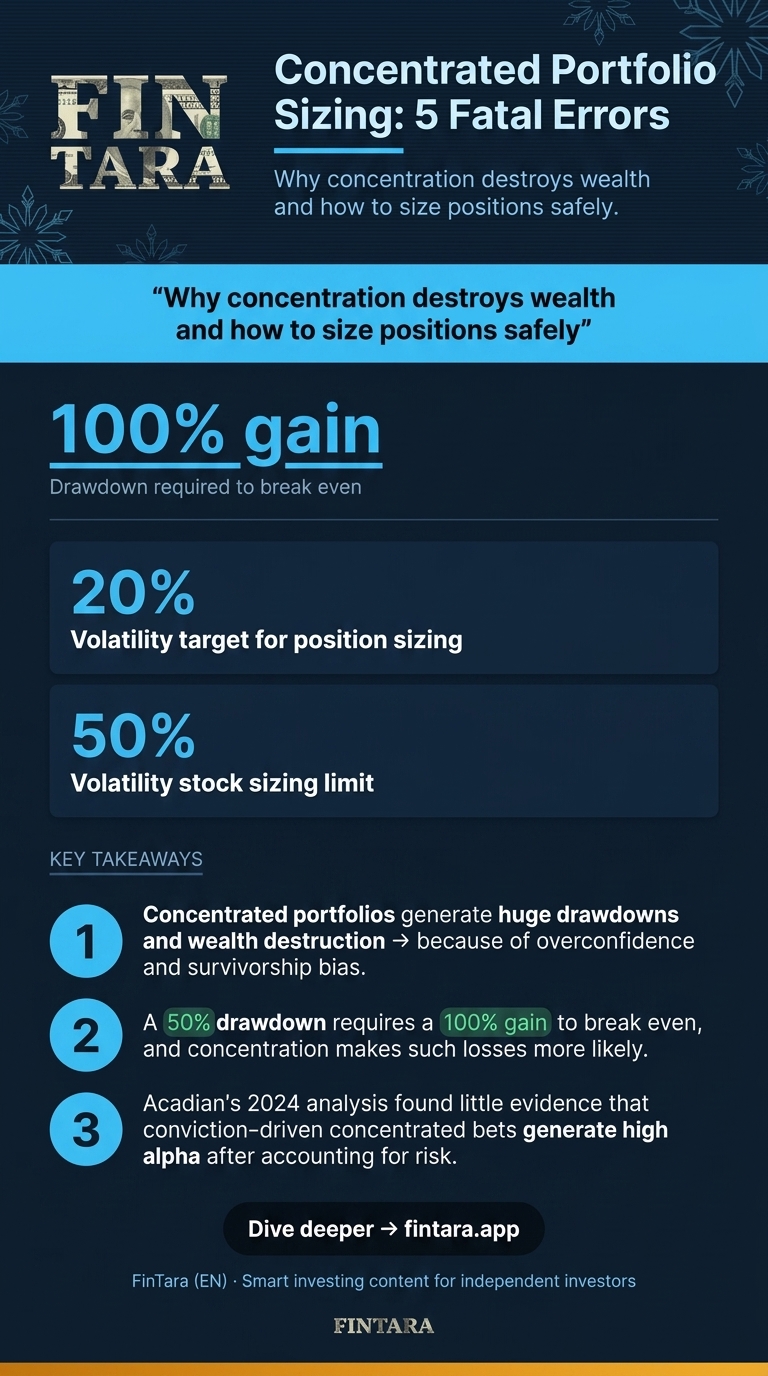
Concentrated portfolios are risky, generating huge drawdowns and massive wealth destruction. Acadian’s 2024 analysis found there is little evidence that concentrated portfolios generate high alpha. The mistaken faith in concentration is driven by overconfident portfolio managers plus the pervasive failure to account for survivorship bias.
You see only the winners who survived. The losers disappear from the record, creating a distorted view of success. Overconfidence compounds this: after a few good picks, you believe skill, not luck, is at work. The math does not support that belief. A 50% drawdown requires a 100% gain just to break even. Concentration makes such drawdowns more likely.
Volatility-Target Position Sizing
 Overconfidence drives oversized bets; the 2022 drawdowns proved the cost of hubris. — Photo by Bia Limova on Pexels
The fix starts with a volatility target. Decide the maximum annualized volatility you can tolerate for a single position. A 20% volatility target on a stock with 40% historical volatility means you size it at 50% of your intended allocation. This mechanically limits risk.
Use the Kelly Criterion as a guardrail, not a gospel. For a stock with a 55% win rate and a 1:2 risk-reward ratio, the Kelly fraction is 0.05 — meaning you risk 5% of capital per trade. For a long-term hold, halve that again. The formula is: (win rate * reward) - (loss rate * risk). Apply it to your historical trades to estimate edge.
Here is the sizing workflow I use mentally before any entry. First, I check the stock’s 5-year average true range (ATR) as a percentage of price. That is my volatility proxy. Second, I compare it to my portfolio’s target volatility. Third, I set the position size so the position’s contribution to portfolio volatility stays under my limit.
Table: Sizing Template for a Concentrated Portfolio
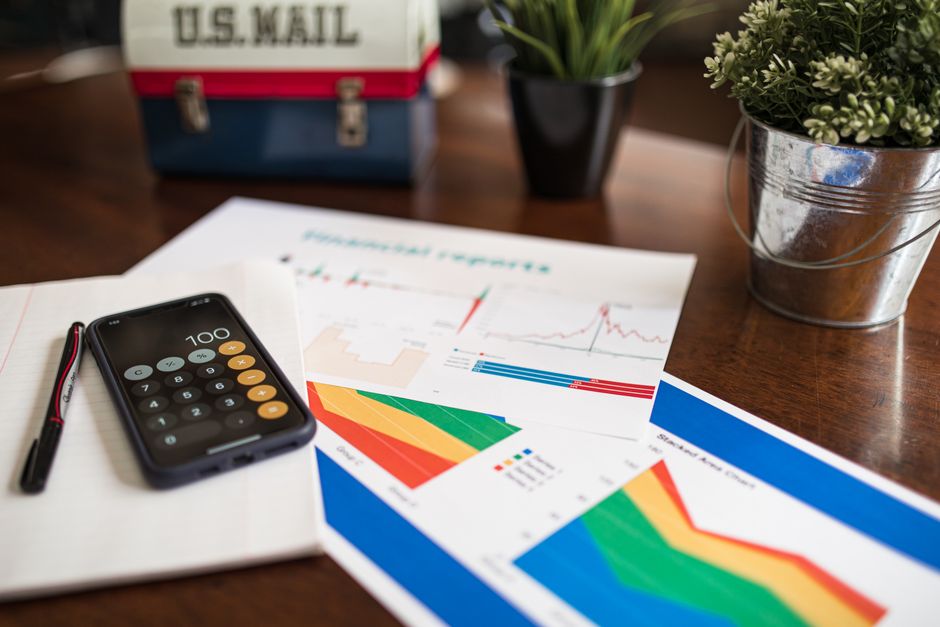 Portfolio sizing errors compound: why fewer positions demand rigorous, evidence-based limits. — Photo by RDNE Stock project on Pexels
| Stock | Current Price | 5-Year ATR % | My Vol Target | Max Position Size | Dollar Value (on $100K) |
|---|---|---|---|---|---|
| PLTR | $25 | 45% | 20% | 44% | $44,000 |
| CRDO | $80 | 50% | 20% | 40% | $40,000 |
| ALAB | $120 | 55% | 20% | 36% | $36,000 |
This table shows how high volatility stocks demand smaller allocations. The ATR percentage is from 2021–2026 data. The dollar values illustrate the math on a $100K portfolio. Note that you cannot max out all three — the total would exceed 100%. That is the point: concentration must be sized, not just desired.
Psychological Tools to Mitigate Overconfidence
 Cover: Analyst reviewing concentrated portfolio charts on desk to avoid fatal sizing errors — Photo by Jakub Zerdzicki on Pexels
Overconfidence is not a feeling; it is a measurable bias in your decision journal. After each trade, record your confidence level (1–10) and the expected return. Compare that to the actual outcome after 30 days. A pattern of overconfidence will emerge if your average confidence is 8+ but returns are random.
Use a pre-trade checklist that forces you to articulate the thesis in one sentence and the risk in one number. For example: “Thesis: Reddit’s ad revenue growth will accelerate due to AI targeting. Risk: 25% drawdown if user growth stalls.” This creates a contract with yourself. If you cannot write it, do not trade.
A second tool is the “devil’s advocate” portfolio. Run a parallel portfolio with the opposite of your top three picks. If your concentrated picks are all tech, the parallel holds staples or utilities. Compare performance quarterly. If your concentrated portfolio underperforms the devil’s advocate for two quarters, reduce size by 50% on the next entry.
Tax-Efficient Sizing for Concentrated Portfolios
Tax drag can create a six-figure gap between gross and after-tax returns over 20 years. On a $500K portfolio, a 1% annual tax drag equals $5,000 per year. Over two decades, that compounds to over $150,000 in lost wealth.
For concentrated portfolios, tax loss harvesting is critical. If a position drops 20%, harvest the loss to offset gains elsewhere. But you must avoid the wash-sale rule: do not rebuy the same stock within 30 days. Instead, rotate into a correlated ETF or a different stock in the same sector.
Another strategy is to hold concentrated positions in tax-advantaged accounts (IRA, 401k) where possible. If you must hold in taxable, use specific lot identification to sell highest-cost shares first. This minimizes capital gains when rebalancing. The goal is to keep the IRS from eroding your edge.
Common Variants: When Volatility Targeting Fails
If volatility targeting feels too restrictive, try equal dollar risk sizing. Instead of capping position size by volatility, cap the dollar risk per trade at 1–2% of portfolio. For a $100K portfolio, risk $1,000–$2,000 per entry. Calculate the stop-loss distance (e.g., 10% below entry) and size accordingly. This works well for swing trades but less for long-term holds.
If you are overconfident despite checks, force a “cooling-off” period. After you decide to buy, wait 48 hours before executing. Write down three reasons you might be wrong. If you cannot list three, you are not thinking critically enough. This pause reduces impulsive sizing errors.
If tax drag is severe, consider charitable donations of appreciated shares. Donate long-term holdings to a donor-advised fund to avoid capital gains tax and get a deduction. This frees up cash to rebalance without triggering taxes. It is a high-net-worth strategy but applies to concentrated portfolios above $100K.
Prevention: Build a Sizing Habit
Create a sizing template in your trading journal. Before any trade, fill out the stock name, ATR percentage, volatility target, and max position size. Make it a non-negotiable step. If you skip it, do not trade.
Review your portfolio quarterly for correlation overlap. Most concentrated portfolios hold mega-cap names that move together. Use a correlation matrix tool (available in Portfolio Visualizer or Morningstar) to check. If two positions correlate above 0.8, reduce one to limit systemic risk.
Finally, set a portfolio volatility target. A 15% annualized volatility is a reasonable goal for a concentrated portfolio. Use a tool like ETF.com’s portfolio analyzer to estimate your current volatility. If you are above 20%, trim positions until you hit the target. This habit prevents drift into reckless concentration.
FAQ
What is the optimal number of stocks in a concentrated portfolio?
There is no universal number, but 5–10 positions is a common range for retail investors. The key is sizing each position to keep portfolio volatility under your target (e.g., 15%). A 5-stock portfolio with equal sizing and 40% volatility stocks will exceed 20% portfolio volatility — you must reduce size per stock.
How do I size positions in a concentrated portfolio to manage risk?
Use volatility targeting. Measure each stock’s 5-year ATR as a percentage of price. Size the position so its contribution to portfolio volatility stays under your limit (e.g., 20%). For a $100K portfolio, a 45% ATR stock gets a max 44% allocation ($44K). This is a guardrail, not a guarantee.
What are the tax implications of holding a concentrated portfolio?
Tax drag can create a six-figure gap over 20 years. Hold concentrated positions in tax-advantaged accounts when possible. In taxable accounts, harvest losses, use specific lot identification, and avoid wash sales. Donate appreciated shares to a donor-advised fund to offset gains.
How can I avoid overconfidence bias when managing concentrated investments?
Use a decision journal. Record your pre-trade confidence level and expected return, then compare to actual outcomes after 30 days. A pattern of high confidence with random returns indicates overconfidence. Force a 48-hour cooling-off period and write three reasons you might be wrong before executing.
What metrics should I use to evaluate a concentrated portfolio’s performance?
Risk-adjusted return (Sharpe ratio) is the key metric. It separates skill from luck by accounting for volatility. Raw return is the wrong scoreboard. Calculate Sharpe ratio quarterly using your portfolio’s excess return over the risk-free rate divided by standard deviation. Aim for Sharpe above 0.5.
How does survivorship bias affect the perception of concentrated portfolio success?
Survivorship bias means you only see the winners that stayed in the market. The losers disappear from databases, creating a distorted view of success. This fuels mistaken faith in concentration. To counter it, track all your trades, including losers, and calculate your actual hit rate and average gain/loss.