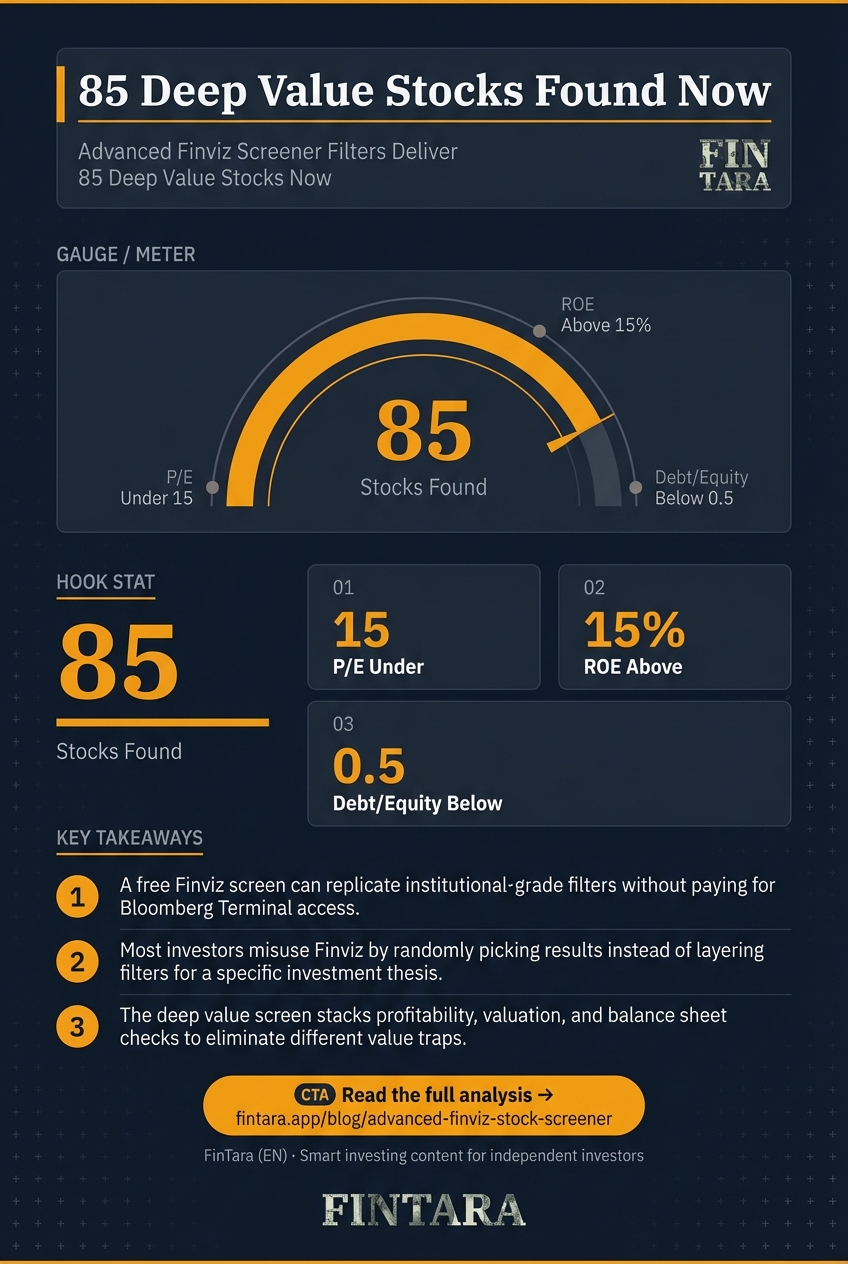
Finviz's advanced screener returns 85 stocks when filtered for deep value criteria: P/E under 15, ROE above 15%, and debt/equity below 0.5. This screen, run in April 2026, surfaced names like SLDE, LYFT, CALM, and HCM. The insight isn't just the list—it's that a free tool can replicate institutional-grade screens if you know which filters matter and how to combine them. For retail investors, this means you can find mispriced quality without paying for Bloomberg Terminal access. The trade-off is data delay and limited international coverage, but the cost savings are real: premium Finviz is $24.96/month versus thousands for professional platforms.
Why most investors misuse Finviz's filter depth
Investors treat Finviz like a search box instead of a logic engine. They slap on P/E and volume filters, get 400 results, and pick a ticker at random. That's not screening—that's lottery ticket selection. The advanced screener has over 70 filters, but the power isn't in adding more; it's in layering complementary criteria that enforce a specific thesis.
A deep value screen works because it stacks three non-redundant checks: profitability (ROE > 15%), valuation (P/E < 15), and balance sheet safety (debt/equity < 0.5). Each filter eliminates a different class of value trap. High ROE without low P/E suggests a quality company that's fairly valued. Low P/E without ROE filters out broken businesses. Low debt ensures the company isn't hiding risk in leverage.
The 85 stocks Finviz returned in April 2026 aren't random. They're the intersection of three independent quality gates. Most investors miss this because they screen sequentially: first valuation, then maybe profitability. That misses stocks that pass all three simultaneously. The tool lets you layer; the user decides how many layers to apply.
Finviz's 70-filter arsenal and what each actually does
 Hands at a desk with financial graphs and a calculator, analyzing business data for value investment criteria. — Photo by RDNE Stock project on Pexels
Finviz organizes its filters into three buckets: fundamental, technical, and descriptive. The fundamental filters are where value investors live: P/E, P/S, ROE, debt/equity, sales growth, EPS growth. Technical filters like RSI, MACD, and volume are for timing, not selection. Descriptive filters (sector, market cap, exchange) are for narrowing, not evaluating.
The April 2026 deep value screen used four fundamental filters. P/E under 15 captures companies trading at historically low earnings multiples. ROE above 15% ensures those earnings are generated efficiently from shareholder equity. Debt/equity below 0.5 limits financial risk. Market cap over $2 billion excludes micro-caps that are too illiquid for most retail accounts.
The screen returned 85 names, including SLDE (P/E 1.55, ROE 57.42%, debt/equity 0.04), LYFT (P/E 1.93, ROE 140.77%, debt/equity 0.40), CALM (P/E 5.27, ROE 27.35%, debt/equity 0.00), and HCM (P/E 5.80, ROE 45.85%, debt/equity 0.08). Each passes the three-gate test, but the thesis for each differs: SLDE is a financial value play, LYFT is a growth-at-a-discount story, CALM is a cyclical with a dividend, HCM is a China healthcare bet.
The free version has a 15-minute quote delay, which matters for intraday traders but not for investors screening for multi-week holds. The premium subscription at $24.96/month removes the delay and adds real-time data, but for value screens that run weekly or monthly, the delay is noise.
When this screen breaks: data gaps and false positives
 Close-up of hands reviewing business report with colorful charts, relating to filtering stocks by fundamental metrics. — Photo by RDNE Stock project on Pexels
The screen has three failure modes. First, data gaps: Finviz covers U.S. stocks, ETFs, and futures, but international equities are limited. If your thesis requires exposure to emerging markets or European cyclicals, you'll need a supplemental tool. Second, false positives: a low P/E can mask a one-time accounting gain that inflates EPS. ROE can be artificially high if equity is depressed by recent losses. Debt/equity doesn't capture off-balance-sheet obligations.
Third, timing mismatch: deep value screens identify cheap stocks, but cheap can stay cheap for years without a catalyst. SLDE's P/E of 1.55 is compelling, but the stock is down 8.06% YTD. LYFT's ROE of 140.77% is extraordinary, but the stock is down 29.22% YTD. The screen finds candidates; it doesn't tell you when to buy.
The 15-minute delay on free quotes can cause slippage if you're trading intraday, but for value screens it's irrelevant. The real limitation is Finviz's U.S.-only focus. If you're building a global portfolio, you'll need to supplement with a tool that covers ADRs, European listings, and Asian markets. The screen is a starting point, not a complete solution.
How to build and export a custom deep value screen
Open Finviz.com, click Screener, then Advanced. Start with the fundamental filters: set P/E to Low (<15), ROE to Over +15%, Debt/Equity to Under 0.5, and Market Cap to Mid ($2B+). This gives you the 85-stock list from April 2026. Save the screen: free users can save up to five custom screens.
Next, layer a technical filter if you want timing signals. Add RSI Under 30 for oversold conditions, or Volume Above Average to confirm institutional interest. Don't overdo it—each additional filter cuts the list further. The goal is 10-20 high-conviction names, not 200 candidates.
To export, click Export on the screener results page. Free users can export up to 50 rows to CSV. Open in Excel or Google Sheets for further analysis. Premium users get unlimited exports and real-time data. The exported file includes ticker, company name, sector, price, and all screened metrics—perfect for building a watchlist or feeding into a portfolio tracker.
For portfolio integration, use the CSV to populate a watchlist in IBKR's TWS platform or TradingView. The data is clean enough for basic tracking, but verify key metrics against the 10-K or 10-Q before committing capital. Finviz is a filter, not a research platform. Use it to find candidates, then dig deeper.
FAQ
How do I set up an advanced stock screen on Finviz?
Open Finviz.com, click Screener, then Advanced. Select filters like P/E < 15, ROE > 15%, and debt/equity < 0.5. Save up to five screens on the free plan. Run it weekly to catch new candidates.
What are the best filters for momentum trading in Finviz?
For momentum, use technical filters: RSI between 30-70, MACD bullish, volume above average, and price above 50-day SMA. Combine with fundamental filters like sales growth > 10% to avoid momentum in broken businesses.
Is Finviz's premium subscription worth it for advanced screening?
Yes if you trade intraday or need real-time quotes. The $24.96/month premium removes the 15-minute delay and adds unlimited exports. For weekly value screens, the free version suffices.
Can I export Finviz screener results to Excel?
Yes. Click Export on the screener results page. Free users get up to 50 rows; premium users get unlimited. The CSV includes ticker, price, and all screened metrics for further analysis.
How does Finviz compare to other stock screeners like TradingView?
Finviz has more fundamental filters and better export options. TradingView excels at charting and technical analysis. Use Finviz for screening, TradingView for timing. They complement each other.
Does Finviz support international stocks in its advanced screener?
Limited. Finviz covers U.S. stocks, ETFs, and futures primarily. International ADRs are included, but foreign listings are not. For global screens, supplement with a tool like Refinitiv or Bloomberg.