
Most retail investors scan revenue and earnings. The investors who consistently anticipate earnings surprises are reading a different set of numbers first — ones buried in supply chain disclosures, freight footnotes, and inventory schedules. Four specific shipping flow metrics tend to move through a company's financials before the headline numbers do. This post identifies them, explains what each one actually signals, and names the conditions where each one breaks down.
Why Revenue-Watchers Miss the Freight Signal
Revenue is a lagging indicator. By the time strong revenue prints, the supply chain that generated it has already run its cycle. Shipping flow metrics sit two to three quarters upstream from the income statement.
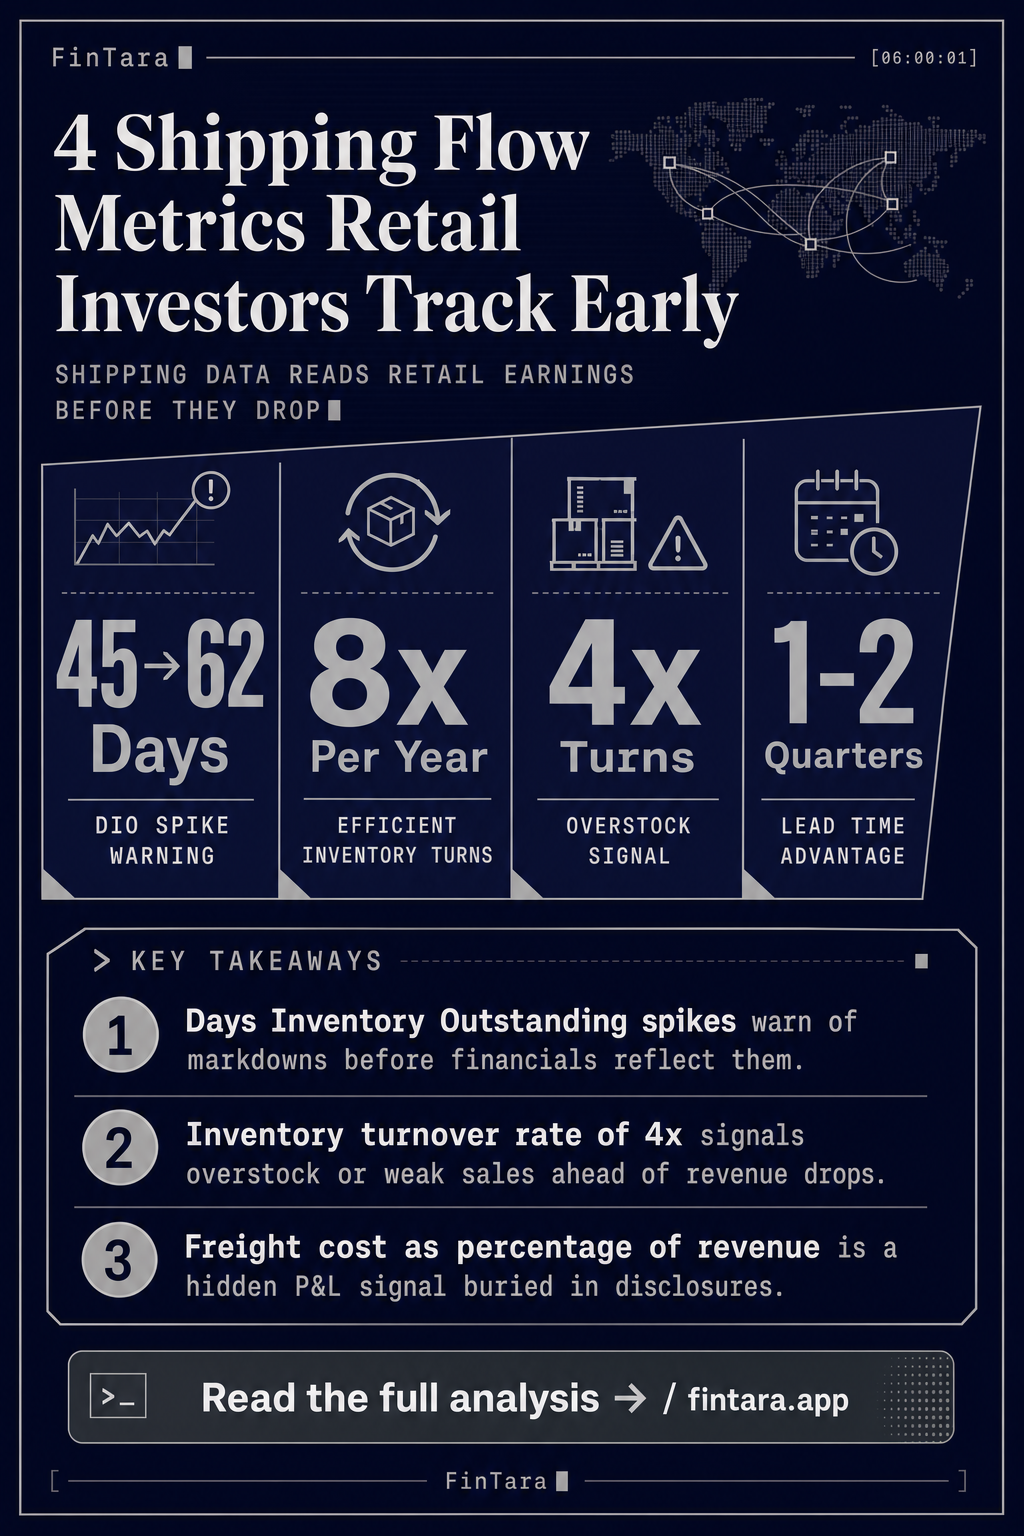
Consider inventory turnover. It measures how many times a company sells and replaces its inventory in a period. A retailer turning inventory 8 times a year is moving product efficiently. One turning it 4 times is either overstocked or underselling. Neither fact shows up in the revenue line until much later — when markdowns hit margins or stockouts hit sales.
Days Inventory Outstanding (DIO) is the inverse: it tells you how many days of supply a company holds. High DIO means product is sitting on shelves or in warehouses. That product was already paid for. Every day it sits, carrying cost accumulates and future pricing power shrinks. When DIO spikes, markdowns usually follow within one to two quarters.
The gap most investors miss: DIO and inventory turnover move before gross margin does. A DIO expansion from 45 days to 62 days signals a margin compression event in the making — not one that already happened. Revenue can still be growing when that warning appears.
Retailers reporting strong top-line growth alongside rising DIO are usually approaching a gross margin cliff. The shipping data flagged it first.
Freight Cost as a Percentage of Revenue: The Hidden P&L Line
 Freight costs hidden within COGS or SG&A can swing gross margins dramatically without any corresponding change in revenue volume. — Photo by AlphaTradeZone on Pexels
Freight cost as a percentage of revenue rarely appears as a standalone line item. Most companies bury it in cost of goods sold or in SG&A, splitting it across segments. Investors who don't read the MD&A and footnotes miss it entirely.
The metric matters because freight costs are highly volatile and only partially within a company's control. When ocean shipping rates spike — as they did during the 2021–2022 supply chain disruption — freight costs can double or triple without any corresponding change in unit volumes. A retailer shipping the same number of containers at twice the freight cost absorbs the hit directly in gross margin. The revenue line doesn't change. The profit line does.
What to watch: freight cost as a share of revenue rising more than 100 basis points year-over-year is a margin stress signal. Below 2% of revenue at a major retailer typically indicates either favorable contract terms or heavy use of intermodal efficiencies. Above 5% for a mid-size retailer suggests either structural inefficiency or a rate environment that's temporarily punishing the whole sector.
The inversion here is important. When freight costs fall sharply — as they did in 2023 after the 2022 peak — retailers with spot-rate exposure see an outsized gross margin tailwind. Investors tracking freight cost ratios in real time could anticipate that margin recovery before it appeared in results. The companies that disclosed freight costs in their filings gave away the answer.
This is also where sector ETFs diverge in ways that aren't obvious from the fund names. If you're trying to read freight exposure through ETF holdings rather than individual company filings, note that the composition differences between transportation-oriented funds matter significantly — something covered in detail for xle vs iyt on new trade flows.
On-Time Delivery Rate: The One Metric Carriers Hide
 Carriers selectively hide on-time delivery data, but tracking it reveals hidden revenue risk for retailers dependent on third-party shipping. — Photo by Tima Miroshnichenko on Pexels
On-time delivery rate measures the percentage of shipments that arrive within the promised window. For logistics companies — UPS, FedEx, regional carriers — it's a direct quality metric. For retailers that depend on those carriers, it's a demand satisfaction and revenue capture metric.
The problem: companies disclose this selectively. Carriers report it when it looks good. They restructure reporting windows or redefine "on-time" when it doesn't. Retail companies almost never disclose their inbound on-time rates because poor performance reflects on their carrier relationships and procurement choices.
Where it shows up anyway: customer satisfaction scores, net promoter surveys, and — most directly — same-store sales velocity following a holiday season. A retailer that experienced late December deliveries from its third-party carriers in Q4 will often show a soft January return rate and a weaker Q1 repurchase cycle. The on-time delivery failure doesn't appear in the income statement. It appears in the cohort behavior of customers who didn't get their orders.
Investors who track third-party shipping performance data from logistics analytics providers can get ahead of this. When major carrier on-time performance degrades in November and December, the retailers most dependent on those carriers for last-mile delivery face a measurable revenue risk in the following quarter.
The failure condition for this metric: it becomes less useful for vertically integrated retailers with proprietary logistics networks. Amazon's delivery performance, for example, is largely independent of UPS and FedEx on-time rates. The metric works best as a signal for mid-size retailers with 70% or more of their last-mile volume on third-party carriers.
Cash Conversion Cycle: Where the Four Metrics Converge
 The cash conversion cycle merges DIO, DSO, and DPO into one figure revealing how many days cash remains tied up in operations. — Photo by Kampus Production on Pexels
The cash conversion cycle (CCC) is the synthesis metric. It combines DIO, days sales outstanding (DSO), and days payable outstanding (DPO) into one number that shows how many days a company's cash is tied up in operations.
CCC = DIO + DSO − DPO
A company with a CCC of 20 days is collecting cash faster than it's deploying it. A company with a CCC of 80 days has nearly three months of cash locked in the pipeline at any given time. In a high-rate environment, that difference carries a real cost — the opportunity cost of capital that can't be redeployed.
The shipping-specific insight: CCC is directly influenced by how fast inventory moves (DIO) and how efficiently freight costs are managed. A retailer that compresses its DIO from 60 to 45 days by improving supply chain velocity doesn't just free up shelf space — it releases working capital. That capital can fund share buybacks, reduce revolving credit utilization, or fund growth without dilution.
Negative CCC is the gold standard. Amazon has historically run a negative CCC by collecting payment from customers before paying suppliers. That structural advantage compounds over years. A retailer moving from a CCC of 55 days to 30 days over three years is undergoing a supply chain transformation that will eventually show up in return on equity — but the CCC data reveals it first.
The ETF FLOW — Global X U.S. Cash Flow Kings 100 ETF — focuses specifically on companies with strong free cash flow characteristics. Its 27.19% return over the trailing 52 weeks as of May 2026 reflects the market's ongoing preference for cash-generative businesses. Many of the holdings that drive that performance are companies that have already compressed their CCC significantly. The metric is a leading indicator; the ETF performance is the lagging confirmation.
For investors who want exposure to this theme without building individual stock positions, understanding which holdings in a cash-flow-focused ETF have improving CCCs is more precise than screening on free cash flow alone. Free cash flow tells you what happened. CCC tells you why — and whether it continues.
FAQ
What's a good inventory turnover ratio for a large retailer?
Varies by format. Grocery retailers often run 15–25x annually because food spoils. General merchandise retailers like Target historically run 4–6x. The number matters less than the direction: a turnover ratio falling year-over-year in the same company is the warning sign, regardless of the absolute level.
Where can retail investors find freight cost data if companies don't report it as a line item?
Search the MD&A section of 10-K and 10-Q filings for "freight," "shipping costs," or "transportation costs." Many companies disclose year-over-year freight cost changes even when they don't break it out explicitly. Earnings call transcripts often include CFO commentary on freight headwinds or tailwinds when the impact is material.
How does days payable outstanding (DPO) relate to shipping metrics?
DPO measures how long a company takes to pay its suppliers. Extending DPO improves CCC on paper but can signal cash stress or supplier friction. A retailer stretching DPO while also seeing DIO rise is likely managing a liquidity problem — both metrics moving the wrong way simultaneously is a higher-conviction warning.
Can these metrics apply to e-commerce companies the same way they apply to brick-and-mortar retailers?
Yes, with one adjustment. E-commerce companies often have lower DIO because they can use drop-shipping or just-in-time fulfillment. But their freight cost as a percentage of revenue tends to be higher — last-mile delivery is expensive. Amazon's logistics investment has compressed that ratio over time, but smaller direct-to-consumer brands often show freight costs at 8–12% of revenue, which substantially limits margin.
Is the FLOW ETF a direct play on supply chain improvement themes?
Not directly. FLOW — Global X U.S. Cash Flow Kings 100 ETF — selects for broad free cash flow strength across 100 large US companies. It's not a logistics or supply chain ETF. As of May 2026, it trades at $39.23 with a 2.04% dividend yield and average daily volume around 1,830 shares, which makes it thinly traded relative to major sector ETFs. Use it as a free cash flow proxy, not a shipping-sector bet.
What's the earliest point in the supply chain where these metrics start signaling trouble?
Freight booking volumes — tracked by ocean freight indexes like the Freightos Baltic Index — precede DIO changes by four to eight weeks. When container booking volumes drop sharply, retailers are cutting inbound orders, which will show up in inventory turnover data one to two quarters later. The booking data is the earliest signal; DIO confirms it.
Supply chains communicate in operating metrics first. Investors who wait for earnings revisions are reading the reply, not the message.