
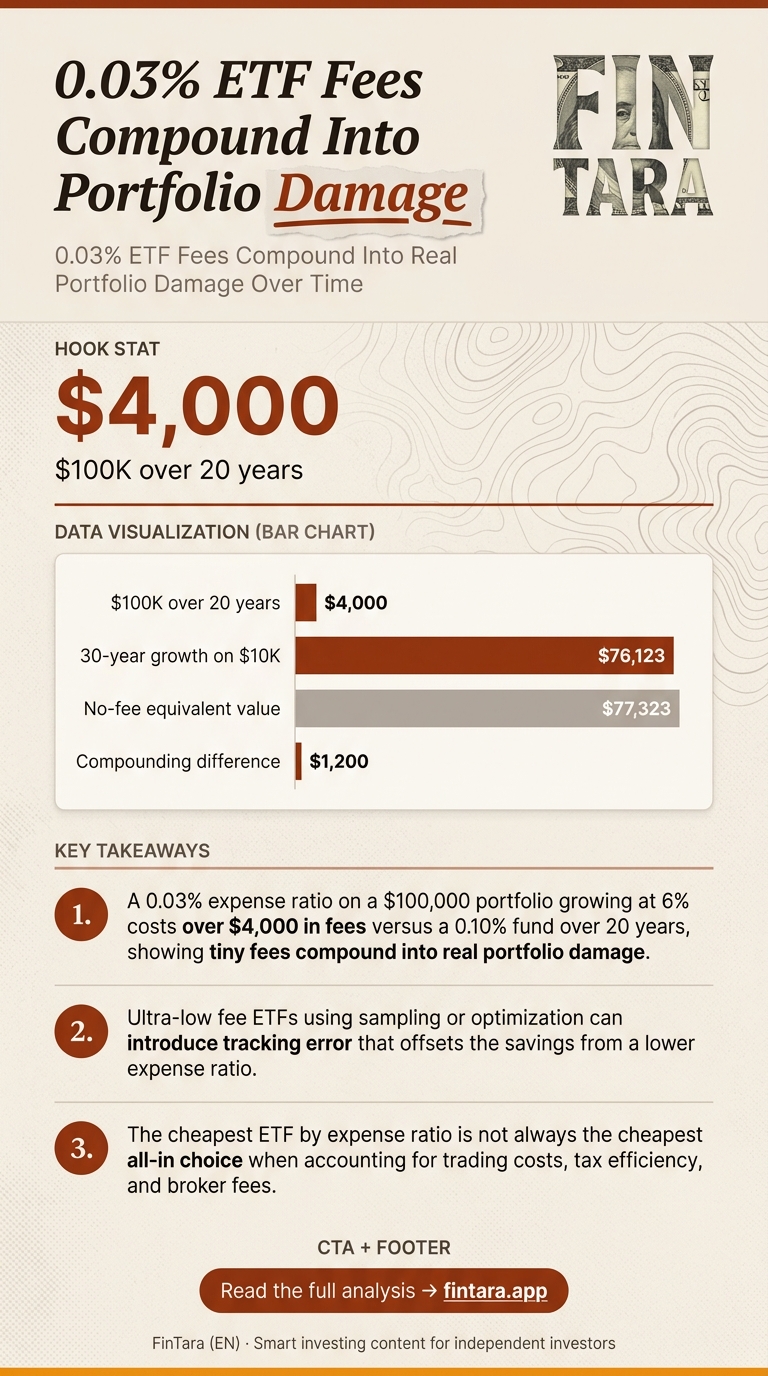
An expense ratio of 0.03% sounds trivial — $0.30 annually per $1,000 invested. Over 20 years, however, that tiny fee on a $100,000 portfolio growing at 6% costs over $4,000 in fees versus a 0.10% fund. The difference between 0.03% and 0.10% is not academic; it is a direct drag on compounding that most investors ignore until they see the final account value. For anyone building a long-term passive portfolio, understanding how ultra-low fees interact with asset allocation, tax efficiency, and broker costs is the non-obvious insight: the cheapest ETF is not always the cheapest all-in choice. This analysis breaks down where fee savings materialize, where they vanish, and what to actually screen for when building a core portfolio.
Why 0.03% Looks Small But Acts Big
Expense ratios are recurring annual costs deducted from fund assets, not a one-time fee. A 0.03% ratio means the fund charges three basis points per year on the total assets under management. For a $50,000 position, that is $15 per year. Over a decade, assuming no contributions or withdrawals, the cumulative cost is not linear — it compounds against your growth. If the underlying index returns 7% annually, the fund returns roughly 6.97% net of fees. That 0.03% gap seems negligible until you model the final value.
The key distortion is mental accounting: investors compare 0.03% to 0.18% and see a “massive” 83% fee reduction. They do not model the dollar impact over 30 years. A $10,000 initial investment in a 0.03% ETF growing at 7% would be worth approximately $76,123 after 30 years. With a 0% fee, the theoretical value is $77,323. The $1,200 difference is real, but the larger risk is overpaying for a 0.18% fund that delivers identical exposure. The 0.03% ETF is not magical — it is simply the baseline for competitive indexing.
Ultra-low fees also come with structural trade-offs. A fund charging 0.03% may use sampling or optimization to replicate an index rather than full replication, which can introduce tracking error. It may also have lower assets under management, affecting liquidity and bid-ask spreads. The fee saving might be eaten by wider spreads during volatile sessions. This is the first inversion: the lowest expense ratio does not guarantee the lowest total cost of ownership. You must model trading costs, tax efficiency, and tracking error alongside the headline number.
Fee Comparison Across Asset Classes And Peer Funds
 Long-term portfolio growth requires calculating fee impact beyond the headline rate — Photo by Lukas Blazek on Pexels
The average expense ratio for U.S. equity ETFs sits around 0.18% as of 2023, per Morningstar. A 0.03% fund is therefore in the bottom decile for cost. Popular examples include certain iShares Core funds like ITOT (U.S. Total Market) and AGG (U.S. Aggregate Bond), though you must verify current expense ratios directly with the issuer. The gap between 0.03% and 0.10% is 7 basis points. On a $100,000 portfolio over 20 years at 6% returns, that 7 basis point difference compounds to over $4,000 in fees — a direct subtraction from terminal value.
Bond ETFs often have lower expense ratios than equity ETFs because the underlying index constituents are fewer and more stable. However, the absolute dollar impact is similar on a per-dollar basis. A 0.03% bond ETF fee still erodes income yield. If a bond fund yields 4.5% gross, the net yield is 4.47%. Over a decade, that 0.03% drag reduces total return in a low-rate environment where every basis point matters. The inversion here is that in a rising rate environment, the fee drag is less painful because capital appreciation dominates; in a flat or falling rate environment, fee differences magnify relative underperformance.
Multi-asset portfolios introduce another layer. If you hold 60% equities in a 0.03% ETF and 40% bonds in a 0.05% ETF, the blended fee is 0.038%. The 2 basis point gap to a fully 0.03% portfolio is minor, but it compounds. More importantly, tax efficiency interacts with fees. In a taxable account, an ETF’s structure typically generates fewer capital gains distributions than a mutual fund, saving taxes that dwarf the 0.03% fee difference. A low-fee mutual fund with high turnover can trigger annual distributions taxed as ordinary income, effectively adding 15–20% in tax drag — far exceeding the expense ratio savings. The 0.03% ETF is not just cheaper; it is often more tax-efficient, which matters more for high-income investors.
Broker-specific fees further complicate the picture. Some brokers charge commissions for trading certain ETFs, while others offer commission-free access to a curated list. If your broker charges $4.95 per trade and you rebalance quarterly, that is $19.80 annually — equivalent to a 0.0198% fee on a $100,000 portfolio. Add this to the 0.03% expense ratio, and the total cost approaches 0.05%. A 0.05% ETF with zero trading costs at your broker may be cheaper than a 0.03% ETF that costs $4.95 per trade. The inversion: the lowest expense ratio ETF is not the cheapest if your broker penalizes it with commissions or poor execution.
When Ultra-Low Fees Fail To Deliver Value
 The mathematical reality that small percentages create substantial dollar losses over time — Photo by Jakub Zerdzicki on Pexels
Fee savings evaporate under specific conditions. First, when tracking error exceeds the fee saving. A 0.03% ETF that underperforms its index by 0.05% annually due to sampling optimization costs you more than a 0.06% ETF with full replication and minimal tracking error. You must compare net return, not net expense ratio. Second, when liquidity is poor. A small ETF with 0.03% fees may have wide bid-ask spreads, especially in volatile markets. If you pay an extra 0.10% on entry and exit, the fee saving is wiped out. Third, when tax efficiency is low. If the ETF generates frequent capital gains distributions, the tax drag can exceed the fee saving, particularly for investors in higher tax brackets.
The failure condition is most acute for small accounts. If you have $5,000 to invest, the absolute dollar saving from 0.03% versus 0.10% is $3.50 per year. Over a decade, that is $35 — less than the cost of a single trade at many brokers. For small accounts, prioritizing commission-free access and low minimums outweighs marginal expense ratio differences. The inversion: do not chase the absolute lowest fee if it means paying trading commissions or holding an illiquid fund. The cheapest all-in choice is the one with the lowest total cost of ownership, which includes trading costs, taxes, and tracking error.
Another failure condition is when the fund closes or merges. Ultra-low-fee ETFs with small AUM are vulnerable to closure. If your ETF liquidates, you may face a taxable event and transaction costs to redeploy capital. The 0.03% fee saving is meaningless if the fund disappears after five years. Check AUM and fund age before committing. A 0.04% ETF with $10 billion AUM and a ten-year track record may be a safer core holding than a 0.03% ETF with $500 million AUM launched last year.
What To Actually Screen For When Choosing Low-Fee ETFs
 Cover: Analyst examines ETF fee impact on portfolio growth charts — Photo by AlphaTradeZone on Pexels
Start with a Finviz screen for ETFs with expense ratios below 0.05%. Filter for AUM above $1 billion to ensure liquidity. Add a filter for average daily volume above 500,000 shares to narrow the list. This screen will return a manageable set of candidates. Next, compare tracking error. Use the fund provider’s fact sheet or a tool like Morningstar to see the three-year tracking error versus the index. If the 0.03% ETF has a tracking error above 0.05%, consider a 0.04% ETF with lower tracking error.
Then, model total cost of ownership. For a taxable account, compare the ETF’s tax efficiency rating (often available on fund provider sites) versus a mutual fund alternative. If the ETF has a tax-cost ratio below 0.10% and the mutual fund is above 0.50%, the ETF’s fee advantage is amplified. For a tax-advantaged account like an IRA, tax efficiency matters less, so focus on expense ratio and tracking error. Finally, check broker compatibility. If your broker offers commission-free trading on a select list, prioritize those ETFs. If not, calculate the commission impact on your rebalancing frequency.
Run a simple backtest using Portfolio Visualizer or a similar tool to compare two ETFs with similar exposure but different fees. Input a $100,000 initial investment, 6% annual return, and 20-year horizon. The difference in terminal value will show the fee impact in dollar terms. This is not a predictive tool — it is a sensitivity analysis. It shows how fee differences compound under realistic return assumptions. The insight: you do not need a perfect 0.03% ETF; you need the ETF that delivers the lowest total cost given your account size, tax situation, and trading habits.
FAQ
How much will a 0.03% ETF fee reduce my returns over 20 years?
On a $100,000 portfolio growing at 6% annually, a 0.03% fee versus a 0% fee reduces final value by approximately $1,200 over 20 years. The gap widens with higher balances and longer horizons.
Are there any ETFs with fees lower than 0.03%?
Some mutual funds or institutional share classes may have lower ratios, but retail ETFs rarely dip below 0.03%. Check current prospectuses for iShares, Vanguard, and State Street funds.
What are the best 0.03% expense ratio ETFs for a core portfolio?
Popular examples include iShares Core U.S. Total Market (ITOT) and Aggregate Bond (AGG), but you must verify the current expense ratio and AUM before investing.
Do ultra-low fee ETFs have higher tracking error?
Not necessarily, but small funds may use sampling methods that increase tracking error. Compare the fund’s three-year tracking error to its index before assuming cost savings.
How do 0.03% ETF fees compare to mutual fund fees?
Mutual funds often charge 0.10–0.50% or more. A 0.03% ETF is cheaper, but tax efficiency and trading costs can flip the equation in taxable accounts.
Should I choose a 0.03% ETF over a 0.05% ETF for a small account?
For small accounts, prioritize commission-free access and liquidity over a 2 basis point fee difference. The dollar savings are minimal compared to trading costs.